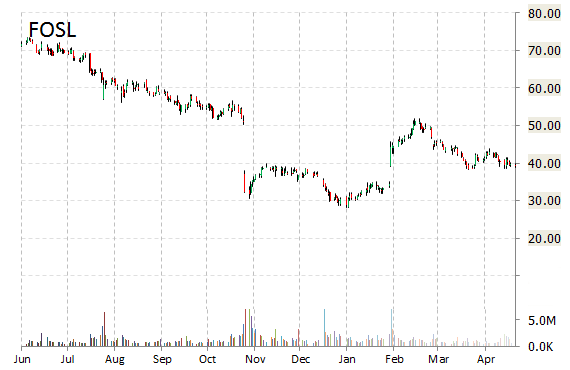
Shares of Fossil Group, Inc. (FOSL) are down $10.08 to $30.02 after the company released its earnings results on Tuesday. The firm reported Q1’16 EPS of $0.12 per share vs. $0.14 consensus on $659.8 million in revenue, down 9.0% from a year ago. For Q2, FOSL provided EPS guidance of 0.00-0.15 versus consensus of $0.58 per share. The company also issued revenue projection of $680 million, compared to the consensus revenue estimate of $701.75 million.
In the past 52 weeks, FOSL shares have traded between a low of $28.26 and a high of $80.22 with the 50-day MA and 200-day MA located at $41.62 and $40.72 levels, respectively. Additionally, shares of FOSL trade at a P/E ratio of (5.60) and have a Relative Strength Index (RSI) and MACD indicator of 41.97 and (1.13), respectively.
Fossil Group stock currently prints a one year loss of about 50.49% and a year-to-date return of around 7.82%.
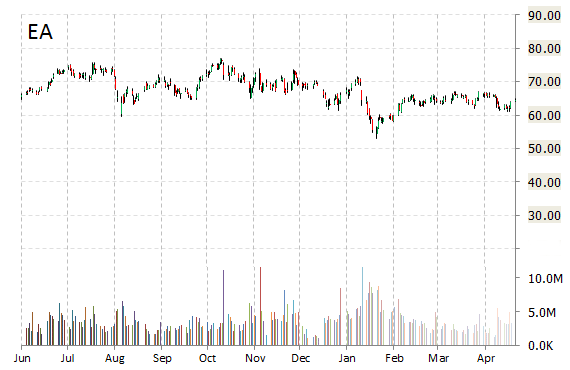
Electronic Arts Inc. (EA) reported first quarter non-GAAP EPS of $0.50 after the closing bell Tuesday, compared to the consensus estimate of $0.42. Revenues increased 3.1% from last year to $924 million. Analysts expected revenues of $889 million. The stock is currently up $4.46 to $69.00 on 7.34 million shares. For FY17, EA provided EPS guidance of $3.50 versus consensus of $3.46 per share. The company also issued revenue projection of non-GAAP revenues of $4.9 billion, compared to the consensus revenue estimate of $4.84 billion.
On valuation-measures, shares of Electronic Arts have a trailing-12 and forward P/E of 33.05 and 18.44, respectively. P/E to growth ratio is 1.16, while t-12 profit margin is 15.26%. EPS registers at 1.95. The company has a market cap of $19.96B and a median Wall Street price target of $81.74 with a high target of $95.00.
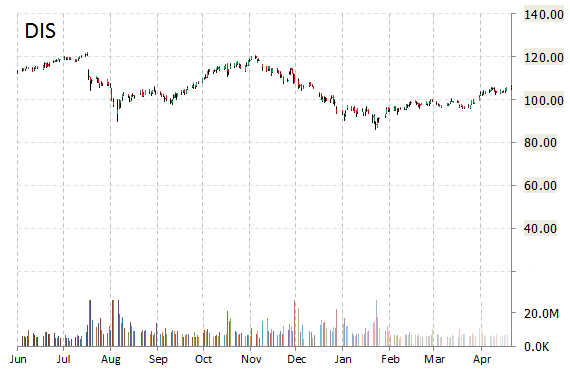
The Walt Disney Company (DIS) dropped $6.54 to $100.06 in after-hours trading after it reported fiscal results for the first quarter.
In its quarterly report, the entertainment company said it earned $1.36 per share, well below the $1.40 per share analysts were expecting. Revenue rose 4.1% to $12.97 billion, above views for $13.20 billion. On valuation measures, Walt Disney shares, which currently have an average 3-month trading volume of 6.91 million shares, trade at a trailing-12 P/E of 19.92, a forward P/E of 17.06 and a P/E to growth ratio of 1.61. The median Wall Street price target on the name is $112.00 with a high target of $134.00. Currently ticker boasts 17 ‘Buy’ endorsements, compared to 14 ‘Holds’ and 2 ‘Sell’.
Profitability-wise, DIS has a t-12 profit and operating margin of 16.72% and 25.90%, respectively. The $173.93 billion market cap company reported $4.30 billion in cash vs. $18.92 billion in debt in its most recent quarter.
Disclaimer: This page contains affiliate links. If you choose to make a purchase after clicking a link, we may receive a commission at no additional cost to you. Thank you for your support!

Leave a Reply