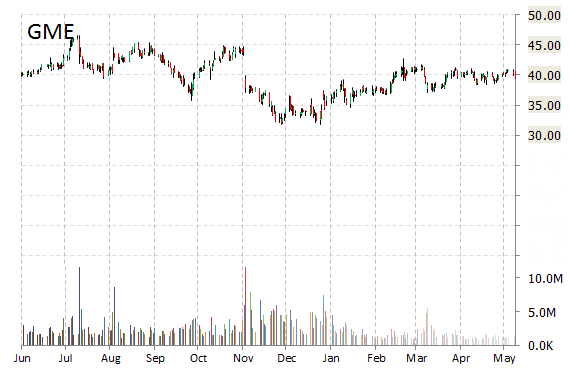
GameStop Corp. (GME) shares are up $2.25 to $43.17 in after-hours trading Thursday after the company reported its first quarter earnings results.
The video game retailer reported earnings of $0.68 per share on revenues of $2.06 billion, up 3.2% from a year ago. Analysts were expecting EPS of $0.59 on revenues of $2.01 billion. The company’s net income for the period ended May 2, 2015 came in at $73.8 million, or $0.68 per diluted share, from $68 million, or $0.59 per diluted share, a year earlier. Same-store sales rose nearly 9% in the quarter.
Paul Raines, chief executive officer, stated, “Our first quarter results exceeded expectations, displaying our market leadership and our ability to drive and leverage our core video game business and expand our diversified businesses to deliver healthy profits and solid top-line growth.”
For Q2/15, GME provided EPS guidance of $0.21 – $0.25 versus consensus of $0.22 per share. Full-year earnings are expected to be $3.63 – $3.83 per share while full year comparable store sales are expected to range from +1.0% to +6.0%.
Cash Position; As of May 2, 2015, the $4.41 billion market cap company reported $370 million in cash vs. $350 million in long-term debt in its most recent quarter.
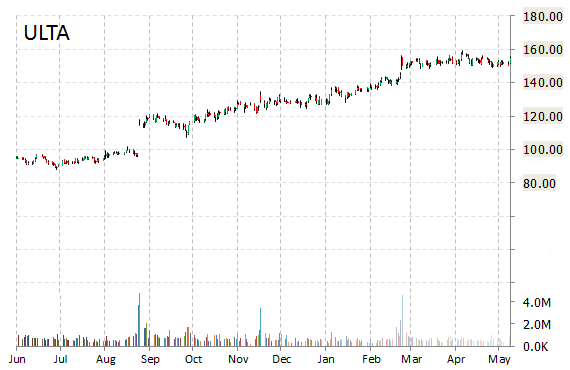
ULTA Salon, Cosmetics & Fragrance, Inc. (ULTA) reported first quarter EPS of $1.04 after the closing bell Thursday, compared to the consensus estimate of $0.93. Revenues increased 21.6% from last year to $868.1 million. Analysts expected revenues of $846.14 million. Net sales for the quarter ended May 2, 2015 increased 21.6% to $868.1 million from $713.8 million in the first quarter of fiscal 2014.
“The ULTA Beauty team delivered an excellent start to 2015, with better than expected sales and earnings growth in the first quarter,” commented Mary Dillon, Chief Executive Officer. “We achieved our best comparable sales growth since 2011, driven by strong traffic growth in both retail and e-commerce, market share gains across all categories, and continued successful execution of our marketing strategies.”
For the current quarter ending in July, the beauty products retailer provided EPS guidance of $1.07 – $1.12 versus consensus of $1.09 per share. The company also issued revenue projection of $854 – $868 million, compared to the consensus revenue estimate of $859.18 million.
The stock is currently up $2.12 to $158.39 on 2.38 million shares.
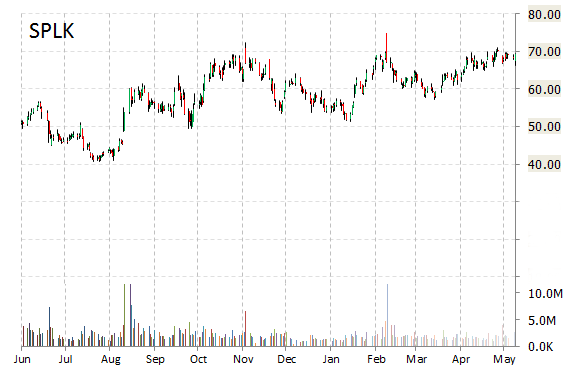
Shares of Splunk, Inc. (SPLK) are down $1.82 to $69.25 after the company released its earnings results on Thursday. The firm reported Q1’15 EPS of ($0.01) per share vs. ($0.03) consensus on $125.7 million in revenue, up 46.3% from $85.9 million a year ago. On a GAAP basis, the company lost 57 cents a share.
Godfrey Sullivan, Chairman and CEO remarked, “Our customers are moving towards enterprise-wide adoption of our products and solutions for a growing set of use cases. Q1 was a strong quarter and we appreciate and thank our 9,500 customers, which now include 80 of the Fortune 100.”
The company said it signed more than 450 new enterprise customers, ending the quarter with over 9,500 customers worldwide.
For Q2/15, SPLK provided revenue guidance of $138-140 million, compared to the consensus revenue estimate of $136.30 million. For the full year, the company sees revenue of $610 million – $614 million, above consensus for $603 million.
On valuation measures, Splunk Inc. shares, which currently have an average 3-month trading volume of 1.86 million shares, trade at a forward P/E of 236.90 and a P/E to growth ratio of 16.83. The median Wall Street price target on the name is $82.00 with a high target of $90.00. Currently ticker boasts 26 ‘Buy’ endorsements, compared to 6 ‘Holds’ and no ‘Sell’.
Profitability-wise, SPLK has a t-12 profit and operating margin of (48.15%) and (47.87%), respectively. The $8.91 billion market cap company reported $413.5 million in cash vs. $425 million in total liabilities in its most recent quarter.
SPLK currently prints a one year return of about 42% and a year-to-date return of 17.66%.
The chart below shows where the equity has traded over the last 52 weeks.
Disclaimer: This page contains affiliate links. If you choose to make a purchase after clicking a link, we may receive a commission at no additional cost to you. Thank you for your support!

Leave a Reply