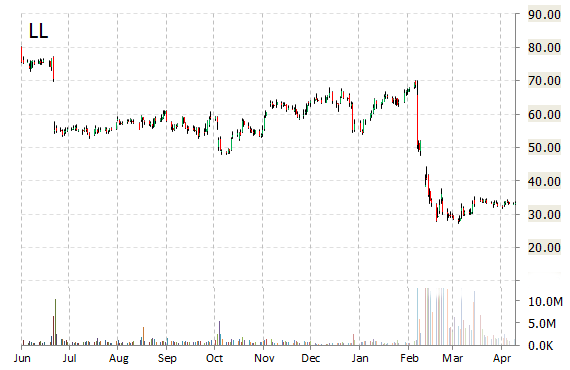
Lumber Liquidators Holdings, Inc. (LL) shares are plunging 16% to $28.10 in pre-market trading Wednesday after the company reported its first quarter earnings results.
The hardwoord floors retailer reported earnings loss of ($0.29) per share on revenues of $259.9 million, up 5.6% from $246.2 million a year ago. Analysts were expecting EPS of $0.15 on revenues of $257 million. Q1 gross margin was 35.2%, down from 41.1% a year earlier. The company’s net income for the period came in at ($7.8) million, or (0.29) per diluted share, from a profit of $13.7 million, or $0.49 per diluted share, a year earlier.
Robert M. Lynch, President and Chief Executive Officer, commented, “Costs related to legal and professional fees and a regulatory accrual were significant in the first quarter, however, we are committed to addressing the challenges presented while maintaining our focus on our core business and value proposition.”
On valuation measures, Lumber Liquidators Holdings Inc. shares, which currently have an average 3-month trading volume of 4.28 million shares, trade at a trailing-12 P/E of 14.47, a forward P/E of 16.30 and a P/E to growth ratio of 1.33. The median Wall Street price target on the name is $40.00 with a high target of $50.00. Currently ticker boasts 4 ‘Buy’ endorsements, compared to 11 ‘Holds’ and no ‘Sell’.
Profitability-wise, LL has a t-12 profit and operating margin of 6.05% and 9.94%, respectively. The $905 million market cap company reported $43.9 million in cash vs. $180.8 million in total liabilities in its most recent quarter.
LL currently prints a one year loss of about 61% and a year-to-date loss of around 50%.
Following the co.’s earnings release, the name was downgraded to ‘Neutral’ from ‘Buy’ at Longbow.
The chart below shows where the equity has traded over the last 52 weeks.
Time Warner Inc. (TWX) reported first quarter non-GAAP EPS of $1.19 before the opening bell Wednesday, compared to the consensus estimate of $1.09. Revenues increased 4.8% from $6.8 billion last year to $7.13 billion. Analysts expected revenues of $6.99 billion. The company’s net income fell to $970 million, or $1.15 per share, in the quarter ended March 31, from $1.29 billion or $1.42 per share, a year earlier.
Chairman and CEO Jeff Bewkes stated: “We got off to a very strong start in 2015, with Revenues up 5%, and Adjusted Operating Income growing 12% to a quarterly record of $1.8 billion. This led to a 23% increase in Adjusted EPS and puts us on track to achieve our goals for the year.
For the full-year 2015, TWX provided EPS guidance of $4.60 – $4.70 versus consensus of $4.65 per share.
Profitability-wise, TWX has a t-12 profit and operating margin of 13.99% and 24.64%, respectively. The $70.58 billion market cap company reported $1.0 billion in cash and $1.0 billion in free cash flow vs. $20.02 billion in net debt in its most recent quarter.
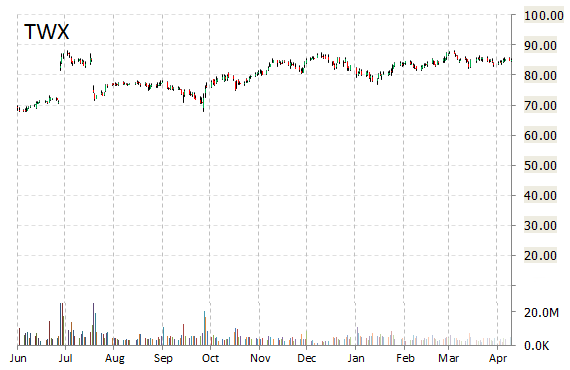
TWX currently prints a one year return of about 38.51% and a year-to-date loss of around 0.10%.
The stock is currently up $1.20 to $86.
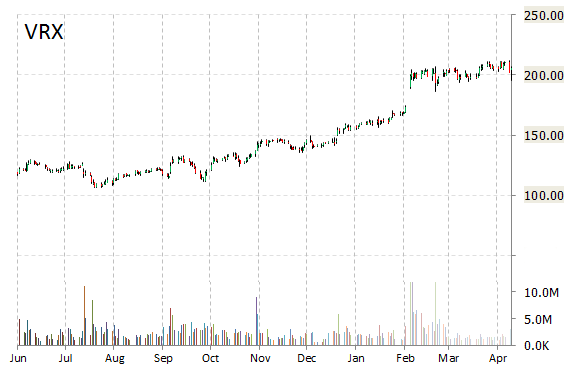
Shares of Valeant Pharmaceuticals International, Inc. (VRX) are up 14c to $205.60 after the company released its earnings results on Wednesday. The drugmaker reported Q1’15 EPS of $2.36 per share vs. $2.34 consensus on $2.19 billion in revenue, up 16.2% from $1.88 billion a year ago. Net income attributable to Valeant came in at $73.7 million, or $0.21 per share, compared to a loss of $22.6 million, or ($0.07) per share, a year earlier.
“Our first quarter results demonstrate the strong performance of our diversified business model as we exceeded our first quarter guidance despite losing $140 million in revenue and $0.12 in Cash EPS to foreign exchange headwinds,” said in a press release J. Michael Pearson, chairman and chief executive officer. “The Company delivered exceptional double digit organic growth for the third quarter in a row, driven by the strength of most of our business units around the world.”
For Q2/15, VRX provided EPS guidance of $2.40 – $2.50 versus consensus of $2.43 per share. The company also issued revenue projection of $2.45 -$2.55 billion, compared to the consensus revenue estimate of $2.56 billion.
Profitability-wise, VRX has a t-12 profit and operating margin of 11.06% and 27.52%, respectively. The $69.08 billion market cap company reported $1.86 billion in cash vs. $28.9 billion in debt in its most recent quarter.
VRX currently prints a one year return of about 54% and a year-to-date return of around 44%.
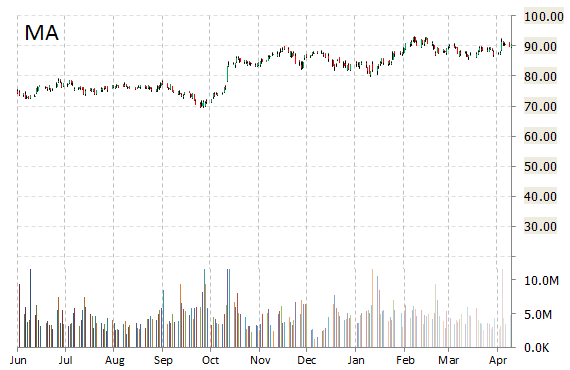
MasterCard Incorporated (MA) rallied $1.59, or 1.76%, to $91.70 in pre-market trading after it reported fiscal results for the first quarter.
In its quarterly report, the payment processing company said it earned $0.89 per share, well above the $0.80 per share analysts were expecting. Revenue rose 2.7% to $2.23 billion, above views for $2.28 billion. For the current quarter, net income was $1.02 billion, or $0.89 per diluted share, compared with net income of $870 million, or $0.73 per diluted share in the first quarter of 2014.
“We are managing well, despite a mixed economic environment and challenging currency situation,” commented Ajay Banga, president and CEO, MasterCard. “The underlying fundamentals of our business remain unchanged, driving our ability to sign new agreements with Citi and Itaú, work with digital giants and expand our support of the merchant community. This, combined with our focus on costs, allowed us to continue to deliver solid results in the first quarter.”
On valuation measures, MasterCard Inc. Cl A shares, which currently have an average 3-month trading volume of 4.21 million shares, trade at a trailing-12 P/E of 29.11, a forward P/E of 21.69 and a P/E to growth ratio of 1.49. The median Wall Street price target on the name is $99.00 with a high target of $114.00. Currently ticker boasts 25 ‘Buy’ endorsements, compared to 7 ‘Holds’ and 1 ‘Sell’.
Profitability-wise, MA has a t-12 profit and operating margin of 38.18% and 53.90%, respectively. The $103.62 billion market cap company reported $4.2 billion in cash vs. $1.49 billion in debt in its most recent quarter.
MA currently prints a one year return of 27.50% and a year-to-date return of 5.12%.
The chart below shows where the equity has traded over the last 52 weeks.
Disclaimer: This page contains affiliate links. If you choose to make a purchase after clicking a link, we may receive a commission at no additional cost to you. Thank you for your support!

Leave a Reply