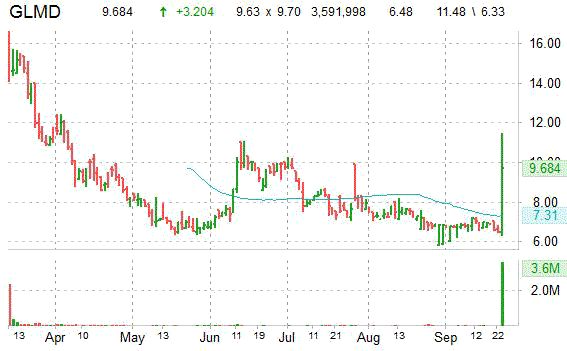
Galmed Pharmaceuticals Ltd. (GLMD) gained $3.17, or 48%, to $9.56 in mid-day trading today following the company’s announcement that the FDA approved its request for Fast Track Designation of its product candidate, aramchol for the treatment of Non-Alcoholic Steato-Hepatitis, or NASH. Approximately 3,451,520 shares have already changed hands, compared to the stock’s average daily volume of 23,672.
Galmed Pharmaceuticals, currently valued at $108.96M, has a median Wall Street price target of $21.50 with a high target of $24.00.
In the past 52 weeks, shares of the clinical-stage biopharmaceutical company have traded between a low of $5.83 and a high of $18.73 with the 50-day MA and 200-day MA located at $7.04 and $8.51 levels, respectively.
GLMD currently prints a one year negative return of 32%.
The chart below shows where the equity has traded over the last 52 weeks, with the 50-day and 200-day MAs included.
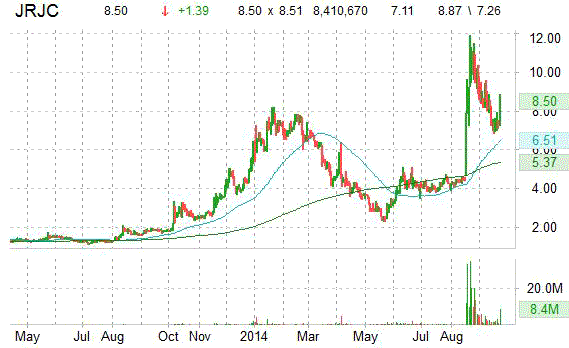
Shares of China Finance Online Co. (JRJC) are up almost 19% to $8.45 after the company announced that it has entered into a strategic partnership agreement with Zhongshan Securities Co. Limited.
China Finance Online’s new partnership with Zhongshan Securities, which is one of the oldest and respected securities firms in China, will allow customers to easily create new trading accounts and offer highly competitive commission rates, which can be as low as 0.025% for new trading accounts.
Approximately 8,394,114 JRJC shares have already changed hands, compared to the stock’s average daily volume of 3,353,260.
On valuation-measures, shares of China Finance Online have a t-12 profit and operating margin of (8.87%) and (12.36%), respectively. EPS registers at ($0.40). The company has a market cap of $185.63M and a median Wall Street price target of $8.30.
On trading-measure, JRJC has a beta of 2.39 and a short float of 20.29%. In the past 52 weeks, shares of the integrated financial information and services company have traded between a low of $1.71 and a high of $11.88 with the 50-day MA and 200-day MA located at $7.38 and $4.96 levels, respectively.
JRJC currently prints a one year return of 346.81% and a year-to-date return of around 34%.
The chart below shows where the equity has traded over the last 52 weeks, with the 50-day and 200-day MAs included.
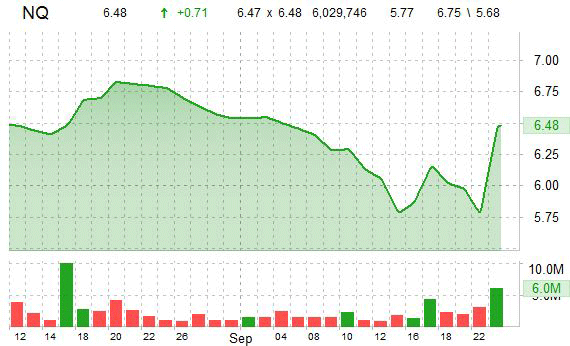
Shares of NQ Mobile Inc. (NQ) climbed over 12% Tuesday as rumors that a private equity firm is considering a buyout of the company in the $9.80 range is crossing trading desks.
Approximately 5,942,238 NQ shares have already changed hands, compared to the stock’s average daily volume of 5,875,490.
On valuation-measures, shares of NQ Mobile Inc. have a forward P/E and P/E to growth ratio of 4.00 and 0.12, respectively. T-12 profit margin is (1.42%), while EPS registers at ($0.05). The company has a market cap of $392.13M and a median Wall Street price target of $33.00 with a high target of $33.00.
On trading-measure, NQ has a beta of 3.69 and a short float of 81.22%. In the past 52 weeks, shares of the mobile Internet services provider have traded between a low of $3.45 and a high of $25.90 with the 50-day MA and 200-day MA located at $6.46 and $9.66 levels, respectively.
NQ currently prints a negative one year return of about 73% and a year-to-date return of around 60%.
The chart below shows where the equity has traded over the last couple of weeks.
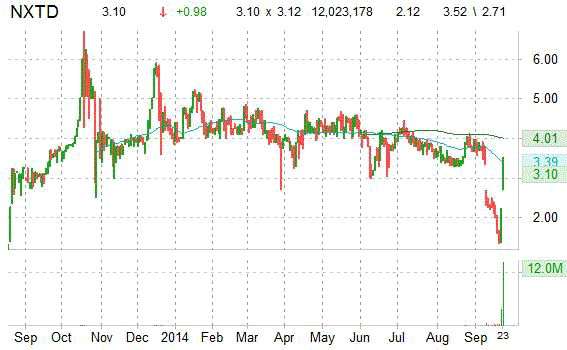
Nxt-ID, Inc. (NXTD) ripping higher in mid-day trading as ticker’s momo appears to be continuing to the upside after the company issued a corporate shareholder update on Monday, following the uplisting to NAS.
On trading-measure, approximately 12,561,561 NXTD shares have already changed hands, compared to the stock’s average daily volume of 112,138. The biometric authentication company has a market cap of $75.63M and a beta of -13.09. In the past 52 weeks, shares of Shelton, Connecticut-based firm have traded between a low of $1.36 and a high of $7.25 with the 50-day MA and 200-day MA located at $3.23 and $3.82 levels, respectively.
NXTD currently prints a one year negative return of about 11.55% and a year-to-date return of 21.50%.
The chart below shows where the equity has traded over the last 52 weeks, with the 50-day and 200-day MAs included.
Disclaimer: This page contains affiliate links. If you choose to make a purchase after clicking a link, we may receive a commission at no additional cost to you. Thank you for your support!
Leave a Reply