Recent short interest data for the 8/29/2014 settlement date shows an increase in short interest for shares of Empire Resorts Inc. (NYNY). As of August 29, the short interest for the gaming and entertainment company totaled 1,606,526 shares, as compared to 1,347,592 shares since August 15, an increase of 19.21%. Average daily volume [AVM] for the same period fell by 75,532 to 65,383 shares from 140,915 shares. It is worth mentioning that ticker’s short interest has jumped by more than 755,390 shares, or 112.15%, from the 3/14/2014 settlement date.
Based on the latest AVM, the days-to-cover ratio — a metric that includes both the total shares short and the average daily volume of shares traded — is currently 24.57 days. Days-to-cover for NYNY increased to 24.57 for the August 29 settlement date, as compared to 9.56 days at the August 15 report.
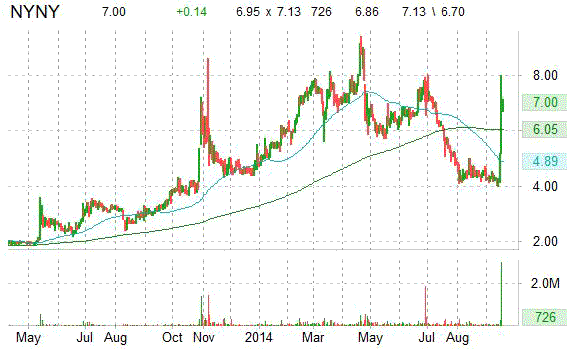
Empire Resorts Inc. has a beta of 1.15 and a short float of 10.77%. In the past 52 weeks, shares of Monticello, New York-based company have traded between a low of $3.11 and a high of $9.39 and are now at $6.86. Shares are up a whopping 117% year-over-year and 41.74% year-to-date.
The chart below shows where the equity has traded over the last year, with the 50-day and 200-day moving averages included.
Recent short interest data for the 8/29/2014 settlement date shows a decrease in short interest for shares of Net Element, Inc. (NETE). As of August 29, the short interest for the mobile commerce and payment processing company totaled 47,572 shares, as compared to 48,738 shares since August 15, a decline of -2.26 %. Average daily volume [AVM] for the same period fell by 12,806 to 15,882 shares from 28,688 shares. It is worth mentioning that ticker’s short interest has declined 86,569 shares, or 64.53%, from the 6/30/2014 settlement date.
Based on the latest AVM, the days-to-cover ratio — a metric that includes both the total shares short and the average daily volume of shares traded — is currently 2.99 days. Days-to-cover for NETE increased to 2.99 for the August 29 settlement date, as compared to 1.69 days at the August 15 report.
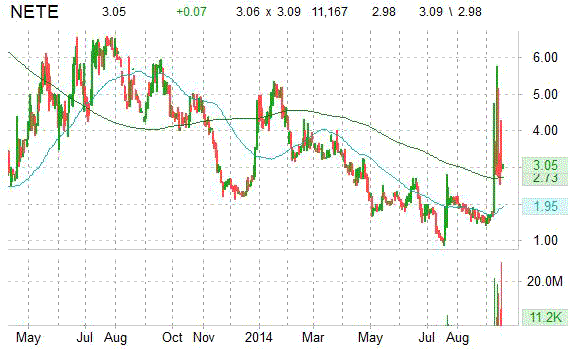
Net Element, Inc. has a beta of 0.50 and a short float of 6.10%. In the past 52 weeks, shares of North Miami Beach, Florida-based company have traded between a low of $0.88 and a high of $5.90 and are now at $2.98. Shares are down 47.90% year-over-year and 31.81% year-to-date.
The chart below shows where the equity has traded over the last year, with the 50-day and 200-day moving averages included.
Recent short interest data for the 8/29/2014 settlement date shows an increase in short interest for shares of Auxilium Pharmaceuticals Inc. (AUXL). As of August 29, the short interest for the specialty biopharmaceutical company totaled 13,491,137 shares, as compared to 12,648,613 shares since August 15, an increase of 6.66%. Average daily volume [AVM] for the same period fell 235,906 to 759,763 shares from 995,669 shares. It is worth mentioning that ticker’s short interest has jumped by more than 7.19M shares, or 114.24%, from the 1/15/2014 settlement date.
Based on the latest AVM, the days-to-cover ratio — a metric that includes both the total shares short and the average daily volume of shares traded — is currently 17.75 days. Days-to-cover for AUXL increased to 17.75 for the August 29 settlement date, as compared to 12.70 days at the August 15 report.
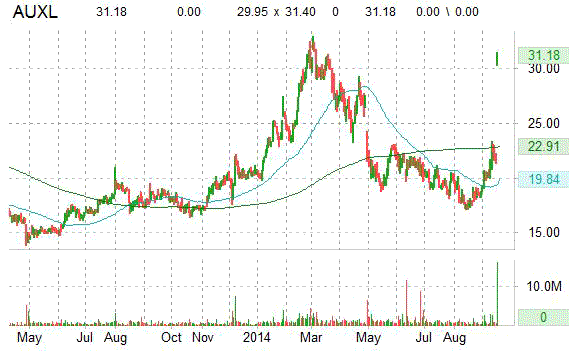
Auxilium Pharmaceuticals Inc. has a beta of 0.66 and a short float of 38.79%. In the past 52 weeks, shares of Chesterbrook, Pennsylvania-based company have traded between a low of $16.36 and a high of $32.89 and are now at $31.18. Shares are up 73.61% year-over-year and 50.41% year-to-date.
The chart below shows where the equity has traded over the last year, with the 50-day and 200-day moving averages included.
Recent short interest data for the 8/29/2014 settlement date shows an increase in short interest for shares of Outerwall Inc. (OUTR). As of August 29, the short interest for the automated retail solutions provider totaled 6,730,042 shares, as compared to 6,194,262 shares since August 15, an increase of 8.65%. Average daily volume [AVM] for the same period fell 513,548 to 473,697 shares from 984,245 shares. It is worth mentioning that ticker’s short interest has declined by more than 2.47M shares, or 26.83%, from the 3/14/2014 settlement date.
Based on the latest AVM, the days-to-cover ratio — a metric that includes both the total shares short and the average daily volume of shares traded — is currently 14.20 days. Days-to-cover for OUTR increased to 14.20 for the August 29 settlement date, as compared to 6.29 days at the August 15 report.
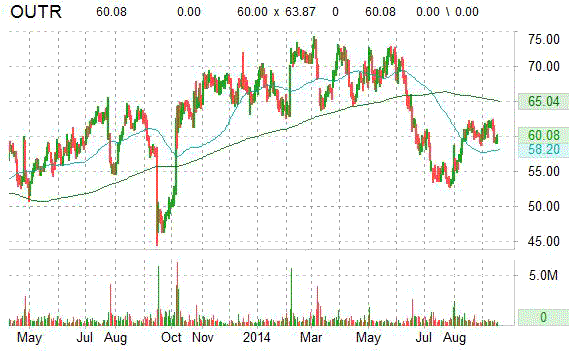
Outerwall Inc. has a beta of 1.26 and a short float of 41.85%. In the past 52 weeks, shares of Bellevue, Washington-based company have traded between a low of $46.26 and a high of $74.30 and are now at $60.08. Shares are up 4.86% year-over-year ; down 10.69% year-to-date.
The chart below shows where the equity has traded over the last year, with the 50-day and 200-day moving averages included.
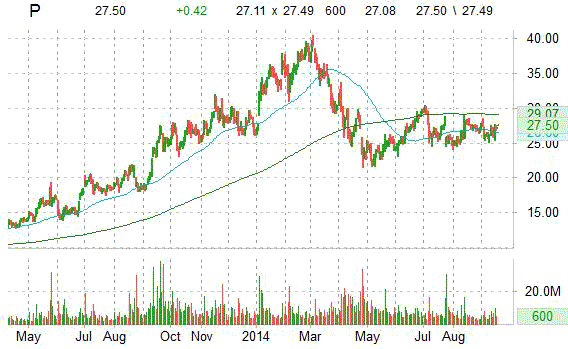
Recent short interest data for the 8/29/2014 settlement date shows a decrease in short interest for shares of Pandora Media, Inc. (P). As of August 29, the short interest for the Internet radio services company totaled 18,565,151 shares, as compared to 19,210,756 shares since August 15, a decline of -3.36%. Average daily volume [AVM] for the same period fell by 2.88M to 4,369,009 shares from 7,249,623 shares. It is worth mentioning that ticker’s short interest has fallen by more than 1.83M shares, or 9%, from the 6/30/2014 settlement date.
Based on the latest AVM, the days-to-cover ratio — a metric that includes both the total shares short and the average daily volume of shares traded — is currently 4.24 days. Days-to-cover for P increased to 4.24 for the August 29 settlement date, as compared to 2.64 days at the August 15 report.
Pandora Media has a beta of 0.55 and a short float of 9.44%. In the past 52 weeks, shares of Oakland, California-based company have traded between a low of $21.47 and a high of $40.44 and are now at $27.08. Shares are up 12.88% year-over-year and 1.80% year-to-date.
The chart below shows where the equity has traded over the last year, with the 50-day and 200-day moving averages included.
Disclaimer: This page contains affiliate links. If you choose to make a purchase after clicking a link, we may receive a commission at no additional cost to you. Thank you for your support!
Leave a Reply