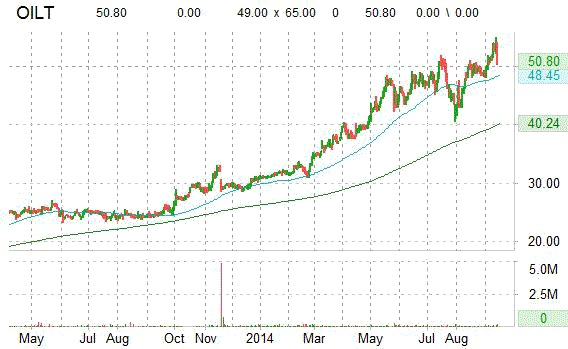
Recent short interest data for the 8/29/2014 settlement date shows a decrease in short interest for shares of Oiltanking Partners, L.P. (OILT). As of August 29, the short interest for the independent crude oil transporter totaled 108,572 shares, as compared to 148,481 shares since August 15, a decline of -26.87 %. Average daily volume [AVM] for the same period fell by about 43,000 to 41,175 shares from 84,725 shares. It is worth mentioning that ticker’s short interest has decreased by 126,284 shares, or 53.77%, from the 2/28/2014 settlement date.
Based on the latest AVM, the days-to-cover ratio — a metric that includes both the total shares short and the average daily volume of shares traded — is currently 2.63 days. Days-to-cover for OILT increased to 2.63 for the August 29 settlement date, as compared to 1.75 days at the August 15 report.
Oiltanking Partners, L.P. has a beta of 0.68 and a short float of 0.39%. In the past 52 weeks, shares of Houston, Texas-based company have traded between a low of $24.62 and a high of $54.95 and are now at $50.80. Shares are up 107.35% year-over-year and 63.69% year-to-date.
The chart below shows where the equity has traded over the last year, with the 50-day and 200-day moving averages included.
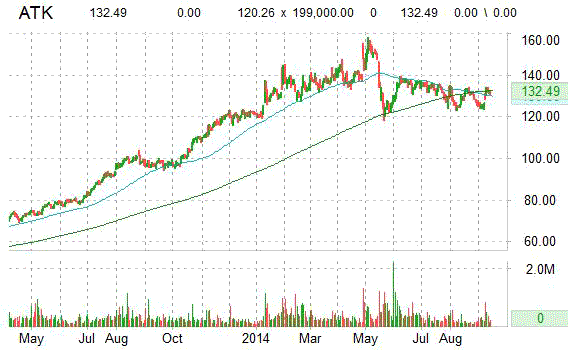
Recent short interest data for the 8/29/2014 settlement date shows a decrease in short interest for shares of Alliant Techsystems Inc. (ATK). As of August 29, the short interest for the aerospace, defense and commercial products company totaled 432,420 shares, as compared to 484,103 shares since August 15, a decline of -10.68 %. Average daily volume [AVM] for the same period fell by 127,621 to 149,226 shares from 276,847 shares. It is worth mentioning that ticker’s short interest has decreased by more than 1.1M shares, or about 275%, from the 6/13/2014 settlement date.
Based on the latest AVM, the days-to-cover ratio — a metric that includes both the total shares short and the average daily volume of shares traded — is currently 2.89 days. Days-to-cover for ATK increased to 2.89 for the August 29 settlement date, as compared to 1.748630 days at the August 15 report.
Alliant Techsystems has a beta of 0.49 and a short float of 1.46%. In the past 52 weeks, shares of Arlington, Virginia-based company have traded between a low of $94.25 and a high of $158.13 and are now at $132.49. Shares are up 36.59% year-over-year and 8.88% year-to-date.
The chart below shows where the equity has traded over the last year, with the 50-day and 200-day moving averages included.
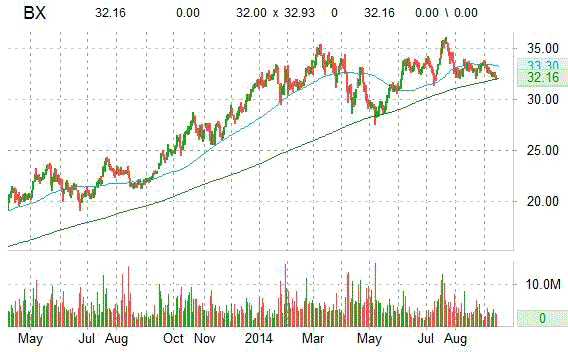
Recent short interest data for the 8/29/2014 settlement date shows a decrease in short interest for shares of The Blackstone Group L.P. (BX). As of August 29, investment manager’s short interest totaled 4,274,169 shares, as compared to 5,319,371 shares since August 15, a decline of -19.65 %. Average daily volume [AVM] for the same period fell by 149,000 to 3,839,791 shares from 3,988,809 shares. It is worth mentioning that ticker’s short interest has fallen by more than 3.5M shares, or 45.04%, from the 4/15/2014 settlement date.
Based on the latest AVM, the days-to-cover ratio — a metric that includes both the total shares short and the average daily volume of shares traded — is currently 1.11 days. Days-to-cover for BX decreased to 1.11 for the August 29 settlement date, as compared to 1.33 days at the August 15 report.
The Blackstone Group has a beta of 1.92 and a short float of 0.82%. In the past 52 weeks, shares of the New York-based company have traded between a low of $23.60 and a high of $36.08 and are now at $32.16. Shares are up 40.87% year-over-year and 2.10% year-to-date.
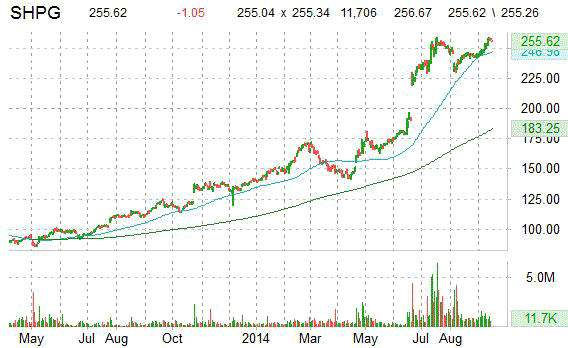
Recent short interest data for the 8/29/2014 settlement date shows a decrease in short interest for shares of Shire plc (SHPG). As of August 29, the short interest for the biopharmaceutical company totaled 1,072,697 shares, as compared to 1,825,863 shares since August 15, a decline of -41.25 %. Average daily volume [AVM] for the same period fell by 799,000 to 801,155 shares from 1,797,333 shares. It is worth mentioning that ticker’s short interest has decreased by 361,000 shares, or 25.19%, from the 7/31/2014 settlement date.
Based on the latest AVM, the days-to-cover ratio — a metric that includes both the total shares short and the average daily volume of shares traded — is currently 1.33 days. Days-to-cover for SHPG increased to 1.33 for the August 29 settlement date, as compared to 1.01 days at the August 15 report.
Shire plc has a beta of 0.76 and a short float of 0.67%. In the past 52 weeks, shares of Dublin, Ireland-based company have traded between a low of $113.59 and a high of $258.55 and are now at $256.67. Shares are up 115.20% year-over-year and 81.66% year-to-date.
The chart below shows where the equity has traded over the last year, with the 50-day and 200-day moving averages included.
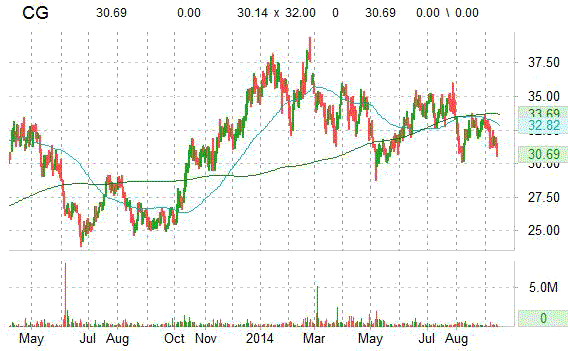
Recent short interest data for the 8/29/2014 settlement date shows an increase in short interest for shares of The Carlyle Group LP (CG). As of August 29, the short interest for the investment firm totaled 729,042 shares, as compared to 581,658 shares since August 15, a jump of 25.32%. Average daily volume [AVM] for the same period fell by 164,269 to 313,790 shares from 478,059 shares. It is worth mentioning that ticker’s short interest has fallen by more than 149,000 shares, or 17.05%, from the 6/13/2014 settlement date.
Based on the latest AVM, the days-to-cover ratio — a metric that includes both the total shares short and the average daily volume of shares traded — is currently 2.32 days. Days-to-cover for CG increased to 2.32 for the August 29 settlement date, as compared to 1.21 days at the August 15 report.
The Carlyle Group has a beta of 2.07 and a short float of 1.10%. In the past 52 weeks, shares of Washington DC-based firm have traded between a low of $24.95 and a high of $39.38 and are now at $30.69. Shares are up 18.91% year-over-year ; down 13.84% year-to-date.
The chart below shows where the equity has traded over the last year, with the 50-day and 200-day moving averages included.
Disclaimer: This page contains affiliate links. If you choose to make a purchase after clicking a link, we may receive a commission at no additional cost to you. Thank you for your support!
Leave a Reply