Recent short interest data for the 8/29/2014 settlement date shows a decrease in short interest for shares of Gilead Sciences Inc. (GILD). As of August 29, the short interest for the biopharmaceutical firm totaled 75,491,965 shares, as compared to 90,068,658 shares since August 15, a decline of -16.18%. Average daily volume [AVM] for the same period increased by 2.76M to 14,328,256 shares from 11,565,205 shares. It is worth mentioning that ticker’s short interest has declined by more than 22M shares, or 16.18%, from the 7/31/2014 settlement date.
Based on the latest AVM, the days-to-cover ratio — a metric that includes both the total shares short and the average daily volume of shares traded — is currently 5.26 days. Days-to-cover for GILD decreased to 5.26 for the August 29 settlement date, as compared to 7.78 days at the August 15 report.
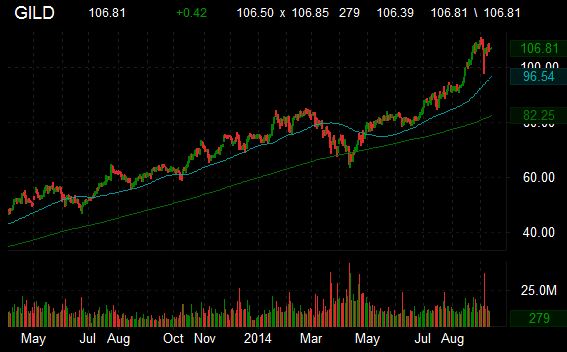
Gilead Sciences has a beta of 0.95 and a short float of 5.03%. In the past 52 weeks, shares of the Foster City, California-based company have traded between a low of $58.81 and a high of $110.64 and are now at $106.39. Shares are up 74.07% year-over-year and 41.66% year-to-date.
The chart below shows where the equity has traded over the last year, with the 50-day and 200-day moving averages included.
Recent short interest data for the 8/29/2014 settlement date shows a decrease in short interest for shares of Biogen Idec Inc. (BIIB). As of August 29, the short interest for the drug maker totaled 3,181,905 shares, as compared to 3,312,332 shares since August 15, a decline of -3.94%. Average daily volume [AVM] for the same period fell by more than 380,000 to 795,409 shares from 1,180,484 shares. It is worth mentioning that ticker’s short interest has jumped by about 563,000 shares, or 21.50%, from the 1/31/2014 settlement date.
Based on the latest AVM, the days-to-cover ratio — a metric that includes both the total shares short and the average daily volume of shares traded — is currently 4.00 days. Days-to-cover for BIIB increased to 4.00 for the August 29 settlement date, as compared to 2.80 days at the August 15 report.
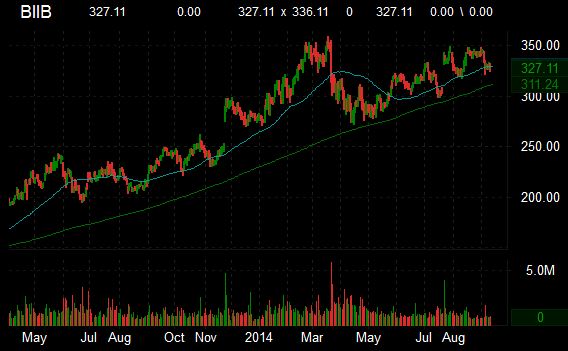
Biogen Idec has a beta of 1.24 and a short float of 1.35%. In the past 52 weeks, shares of the Cambridge, Massachusetts-based company have traded between a low of $221.07 and a high of $358.89 and are now at $327.11. Shares are up 45.27% year-over-year and 17% year-to-date.
The chart below shows where the equity has traded over the last year, with the 50-day and 200-day moving averages included.
Recent short interest data for the 8/29/2014 settlement date shows an increase in short interest for shares of Celgene Corporation (CELG). As of August 29, the short interest for the biopharmaceutical company totaled 13,611,110 shares, as compared to 13,046,823 shares since August 15, an increase of 4.33%. Average daily volume [AVM] for the same period jumped by 355,000 to 4,013,396 shares from 3,658,206 shares. It is worth mentioning that ticker’s short interest has jumped by more than 9M shares, or 197.30%, from the 1/15/2014 settlement date.
Based on the latest AVM, the days-to-cover ratio — a metric that includes both the total shares short and the average daily volume of shares traded — is currently 3.39 days. Days-to-cover for CELG decreased to 3.39 for the August 29 settlement date, as compared to 3.56 days at the August 15 report.
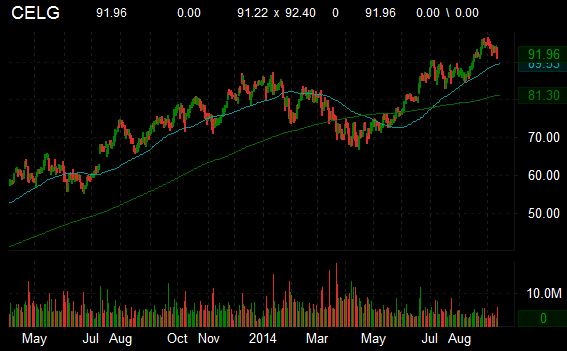
Celgene Corporation has a beta of 1.10 and a short float of 1.71%. In the past 52 weeks, shares of the Summit, New Jersey-based company have traded between a low of $66.85 and a high of $96.44 and are now at $91.96. Shares are up 25.15% year-over-year and 8.85% year-to-date.
The chart below shows where the equity has traded over the last year, with the 50-day and 200-day moving averages included.
Recent short interest data for the 8/29/2014 settlement date shows a small decrease in short interest for shares of Alliance Data Systems Corporation (ADS). As of August 29, the short interest for the provider of marketing solutions totaled 2,142,201 shares, as compared to 2,154,288 shares since August 15, a decline of -0.56%. Average daily volume [AVM] for the same period fell by 233,000 to 339,799 shares from 572,938 shares. It is worth mentioning that ticker’s short interest has declined by more than 3.5M shares, or 62.21%, from the 5/30/2014 settlement date.
Based on the latest AVM, the days-to-cover ratio — a metric that includes both the total shares short and the average daily volume of shares traded — is currently 6.30 days. Days-to-cover for ADS increased to 6.30 for the August 29 settlement date, as compared to 3.76 days at the August 15 report.
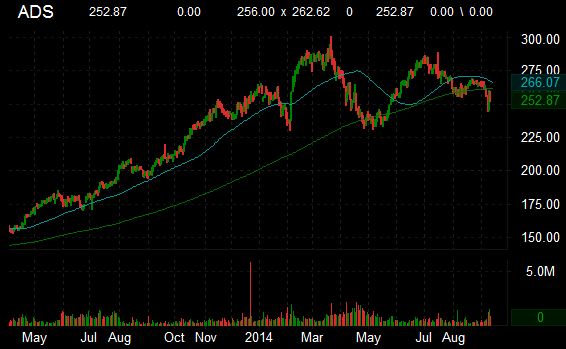
Alliance Data Systems has a beta of 1.19 and a short float of 3.96%. In the past 52 weeks, shares of the Plano, Texas-based company have traded between a low of $203.62 and a high of $300.49 and are now at $252.87. Shares are up 26.80% year-over-year ; down 3.83% year-to-date.
The chart below shows where the equity has traded over the last year, with the 50-day and 200-day moving averages included.
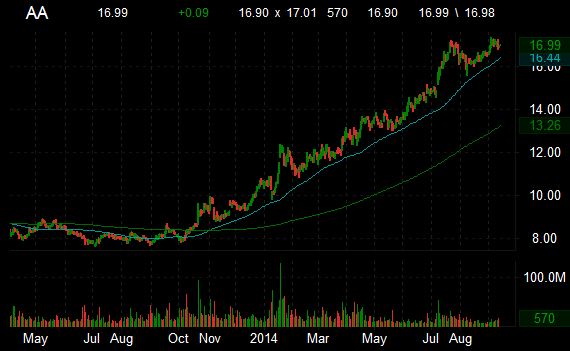
Recent short interest data for the 8/29/2014 settlement date shows a decrease in short interest for shares of Alcoa Inc. (AA). As of August 29, the short interest for the producer of primary aluminum totaled 61,378,929 shares, as compared to 64,081,888 shares since August 15, a decline of -4.22%. Average daily volume [AVM] for the same period fell by about 3.78M to 9,225,937 shares from 13,006,932 shares. It is worth mentioning that ticker’s short interest has declined by more than 69.4M shares, or 53.07%, from the 1/31/2014 settlement date.
Based on the latest AVM, the days-to-cover ratio — a metric that includes both the total shares short and the average daily volume of shares traded — is currently 6.65 days. Days-to-cover for AA increased to 6.65 for the August 29 settlement date, as compared to 4.92 days at the August 15 report.
Alcoa Inc. has a beta of 1.54 and a short float of 5.25%. In the past 52 weeks, shares of the New York-based company have traded between a low of $7.82 and a high of $17.36 and are now at $16.90. Shares are up 113.38% year-over-year and 58.98% year-to-date.
The chart below shows where the equity has traded over the last year, with the 50-day and 200-day moving averages included.
Disclaimer: This page contains affiliate links. If you choose to make a purchase after clicking a link, we may receive a commission at no additional cost to you. Thank you for your support!
Leave a Reply