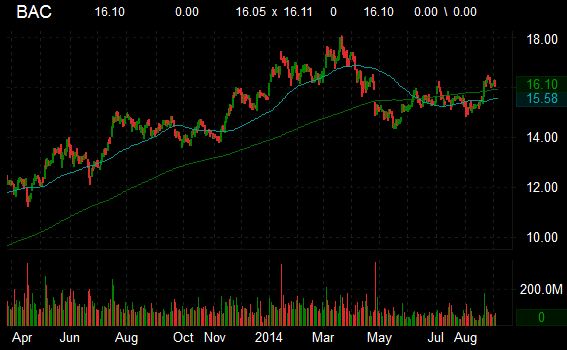
Recent short interest data for the 8/15/2014 settlement date shows an increase in short interest for shares of Bank of America Corp (BAC). As of August 15, the mega bank’s short interest totaled 103,851,135 shares, as compared to 102,285,138 shares since July 31, an increase of about 1.53%. Average daily volume [AVM] for the same period fell by almost 7M to 60,420,034 shares from 67,323,592 shares. It is worth noting that ticker’s short interest has fallen 32.89% from the 2/28/2014 settlement date.
Based on the latest AVM, the days-to-cover ratio — a metric that includes both the total shares short and the average daily volume of shares traded — is currently 1.71 days. Days-to-cover for BAC increased to 1.71 for the August 15 settlement date, as compared to 1.51 days at the July 31 report.
BofA has a beta of 1.92 and a short float of 0.90%. In the past 52 weeks, shares of Bank of America have traded between a low of $13.60 and a high of $18.03 and are now at $16.10. Shares are up 14.02% year-over-year, and 3.4% year-to-date.
The chart below shows where the equity has traded over the last year, with the 50-day and 200-day moving averages included.
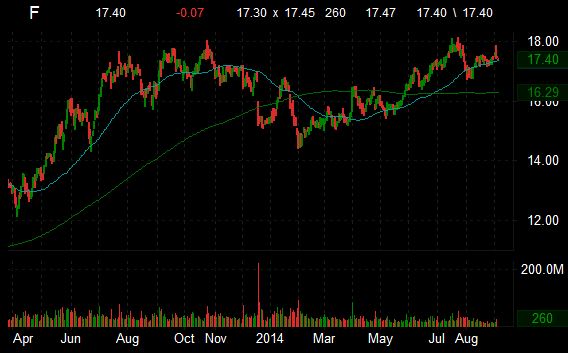
Recent short interest data for the 8/15/2014 settlement date shows an increase in short interest for shares of Ford Motor Company (F). As of August 15, the automaker’s short interest totaled 77,140,664 shares, as compared to 75,215,684 shares since July 31, an increase of about 2.56%. Average daily volume [AVM] for the same period fell by almost 9M to 24,076,551 shares from 33,182,110 shares. It is worth noting that ticker’s short interest has climbed 17.61% from the 4/15/2014 settlement date.
Based on the latest AVM, the days-to-cover ratio — a metric that includes both the total shares short and the average daily volume of shares traded — is currently 3.20 days. Days-to-cover for Ford increased to 3.20 for the August 15 settlement date, as compared to 2.26 days at the July 31 report.
Ford has a beta of 1.25 and a short float of 2.00%. In the past 52 weeks, shares of the Dearborn, Michigan-based car manufacturer have traded between a low of $14.40 and a high of $18.03 and are now at $18.12. Shares are up 7.91% year-over-year and 13.22% year-to-date.
The chart below shows where the equity has traded over the last year, with the 50-day and 200-day moving averages included.
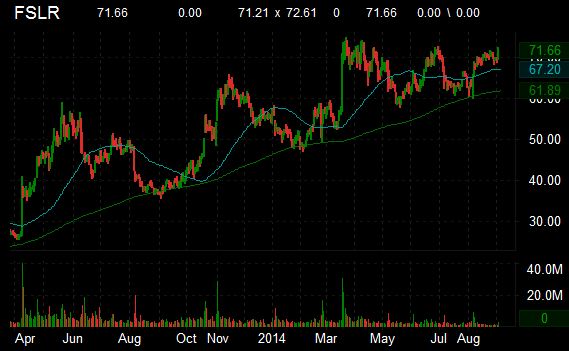
Recent short interest data for the 8/15/2014 settlement date shows a relatively small increase in short interest for shares of First Solar, Inc. (FSLR). As of August 15, the short interest for the solar energy solutions provider totaled 10,330,952 shares, as compared to 9,581,086 shares since July 31, an increase of 7.81%. Average daily volume [AVM] for the same period jumped by almost 1.5M to 3,508,566 shares from 2,044,547 shares. It is worth noting that ticker’s short interest has declined 20.74% from the 2/28/2014 settlement date.
Based on the latest AVM, the days-to-cover ratio — a metric that includes both the total shares short and the average daily volume of shares traded — is currently 2.94 days. Days-to-cover for FSLR decreased to 2.94 for the August 15 settlement date, as compared to 4.68 days at the July 31 report.
First Solar has a beta of 2.24 and a short float of 11.10%. In the past 52 weeks, shares of the Tempe, Arizona-based solar energy company have traded between a low of $36.58 and a high of $74.84 and are now at $71.66. Shares are up 95.15% year-over-year and 31.15% year-to-date.
The chart below shows where the equity has traded over the last year, with the 50-day and 200-day moving averages included.
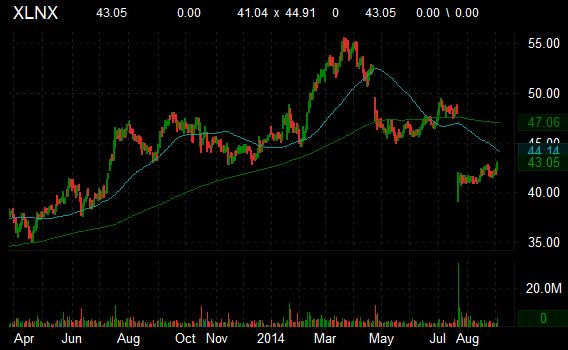
Recent short interest data for the 8/15/2014 settlement date shows a fractional decrease in short interest for shares of Xilinx Inc. (XLNX). As of August 15, the short interest for the designer of programmable devices totaled 6,112,408 shares, as compared to 6,151,862 shares since July 31, a decline of less than one percent. Average daily volume [AVM] for the same period fell by almost 3.9M to 3,414,171 shares from 7,264,185 shares. It is worth noting that ticker’s short interest has fallen by 18M shares, or 66.17%, from the 2/14/2014 settlement date.
Based on the latest AVM, the days-to-cover ratio — a metric that includes both the total shares short and the average daily volume of shares traded — is currently 1.79 days. Days-to-cover for XLNX increased to 1.79 for the August 15 settlement date, as compared to 1.00 days at the July 31 report.
Xilinx Inc. has a beta of 1.58 and a short float of 1.40%. In the past 52 weeks, shares of the San Jose, California-based firm have traded between a low of $39.12 and a high of $55.59 and are now at $43.05. Shares are down 0.85% year-over-year and 6.25% year-to-date.
The chart below shows where the equity has traded over the last year, with the 50-day and 200-day moving averages included.
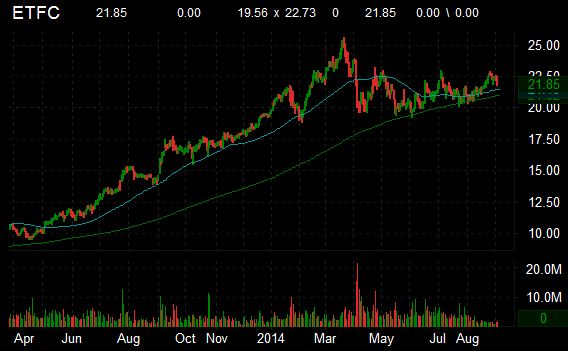
Recent short interest data for the 8/15/2014 settlement date shows a decrease in short interest for shares of E TRADE Financial Corporation (ETFC). As of August 15, the short interest for the brokerage firm totaled 5,158,824 shares, as compared to 7,236,330 shares since July 31, a decline of about 29%. Average daily volume [AVM] for the same period fell by almost 2M to 2,383,353 shares from 4,281,732 shares. It is worth noting that ticker’s short interest has fallen 67.80% from the 1/15/2014 settlement date.
Based on the latest AVM, the days-to-cover ratio — a metric that includes both the total shares short and the average daily volume of shares traded — is currently 2.16 days. Days-to-cover for ETFC increased to 2.16 for the August 15 settlement date, as compared to 1.70 days at the July 31 report.
E TRADE has a beta of 2.46 and a short float of 3.00%. In the past 52 weeks, shares of THE New York, New York-based financial services company have traded between a low of $15.53 and a high of $25.58 and are now at $21.85. Shares are up 55.63% year-over-year and 11.25% year-to-date.
The chart below shows where the equity has traded over the last year, with the 50-day and 200-day moving averages included.
Disclaimer: This page contains affiliate links. If you choose to make a purchase after clicking a link, we may receive a commission at no additional cost to you. Thank you for your support!
Leave a Reply