Recent short interest data for the 8/15/2014 settlement date shows an increase in short interest for shares of Radian Group Inc. (RDN). As of August 15, the mortgage insurer’s short interest totaled 38,497,490 shares, as compared to 36,294,674 shares since July 31, an increase of about 6%. Average daily volume [AVM] for the same period rose by 371,000 to 4,356,835 shares from 3,985,992 shares. It is worth noting that ticker’s short interest has fallen by more than 11M, or 22.6%, from the 12/13/2013 settlement date.
Based on the latest AVM, the days-to-cover ratio — a metric that includes both the total shares short and the average daily volume of shares traded — is currently 8.8 days. Days-to-cover for RDN decreased to 8.8 for the August 15 settlement date, as compared to 9.10 days at the July 31 report.
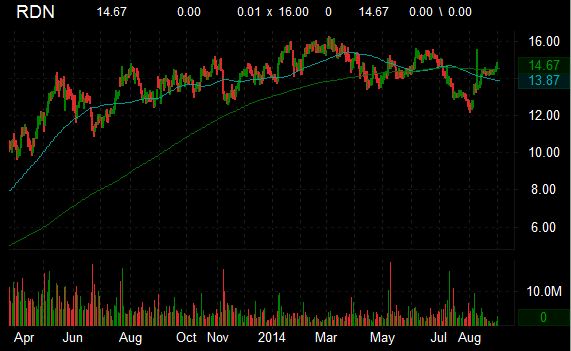
Radian has a beta of 2.51 and a short float of 21.60%. In the past 52 weeks, shares of Radian Group have traded between a low of $12.18 and a high of $16.24 and are now at $14.67. Shares are up 8.27% y/y, and 4% year-to-date.
The chart below shows where the equity has traded over the last year, with the 50-day and 200-day moving averages included.
Recent short interest data for the 8/15/2014 settlement date shows a decrease in short interest for shares of Netflix, Inc. (NFLX). As of August 15, the short interest for the provider of on-demand Internet streaming media totaled 5,675,388 shares, as compared to 5,767,138 shares since July 31, a decrease of about 1.60%. Average daily volume [AVM] for the same period fell by more than 700,000 to 2,090,805 shares from 2,717,719 shares. It is worth noting that ticker’s short interest has increased by more than 1.76M, or 45.17%, from the 3/31/2014 settlement date.
Based on the latest AVM, the days-to-cover ratio — a metric that includes both the total shares short and the average daily volume of shares traded — is currently 2.71 days. Days-to-cover for NFLX increased to 2.71 for the August 15 settlement date, as compared to 2.12 days at the July 31 report.
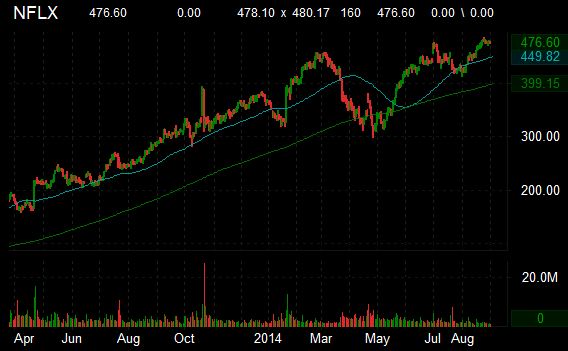
Netflix has a beta of 2.26 and a short float of 9.20%. In the past 52 weeks, shares of Netflix, Inc. have traded between a low of $282.80 and a high of $485.30 and are now at $476.60. Shares are up 67.87% y/y, and 29.45% year-to-date.
The chart below shows where the equity has traded over the last year, with the 50-day and 200-day moving averages included.
In other Netflix news, The Wall Street Journal reports that the company has reached a deal with Time Warner Inc.’s Warner Bros. “to secure streaming rights in the U.S. and international markets for “Gotham,” a TV show that tells of the city before Batman, and is one of the fall’s most anticipated new dramas, according to people familiar with the matter.”
Recent short interest data for the 8/15/2014 settlement date shows an increase in short interest for shares of Marvell Technology Group Ltd. (MRVL). As of August 15, the short interest for the provider of application-specific standard products totaled 8,883,070 shares, as compared to 7,405,099 shares since July 31, an increase of about 20%. Average daily volume [AVM] for the same period fell by 1.9M to 4,463,200 shares from 6,381,774 shares. It is worth noting that ticker’s short interest has increased by more than 5.3M, or 152.42%, from the 6/13/2014 settlement date.
Based on the latest AVM, the days-to-cover ratio — a metric that includes both the total shares short and the average daily volume of shares traded — is currently 1.99 days. Days-to-cover for MRVL increased to 1.99 for the August 15 settlement date, as compared to 1.16 days at the July 31 report.
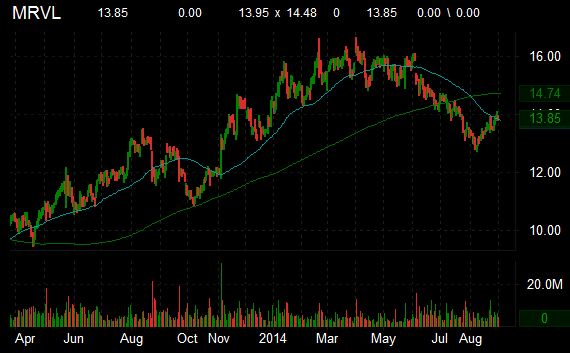
Marvell Tech has a beta of 0.74 and a short float of 1.10%. In the past 52 weeks, shares of Marvell Technology Group have traded between a low of $10.87 and a high of $16.65 and are now at $13.85. Shares are up 14.37% y/y. Year-to-date ticker posts negative returns of 3.69%.
The chart below shows where the equity has traded over the last year, with the 50-day and 200-day moving averages included.
Recent short interest data for the 8/15/2014 settlement date shows an increase in short interest for shares of GT Advanced Technologies Inc (GTAT). As of August 15, the company’s short interest totaled 56,539,049 shares, as compared to 48,236,023 shares since July 31, an increase of about 17.21%. Average daily volume [AVM] for the same period fell to 9,042,061 shares from 9,105,905 shares. It is worth noting that ticker’s short interest has jumped by almost 26M, or 84.21%, from the 1/31/2014 settlement date.
Based on the latest AVM, the days-to-cover ratio — a metric that includes both the total shares short and the average daily volume of shares traded — is currently 6.25 days. Days-to-cover for GTAT increased to 6.25 for the August 15 settlement date, as compared to 5.29 days at the July 31 report.
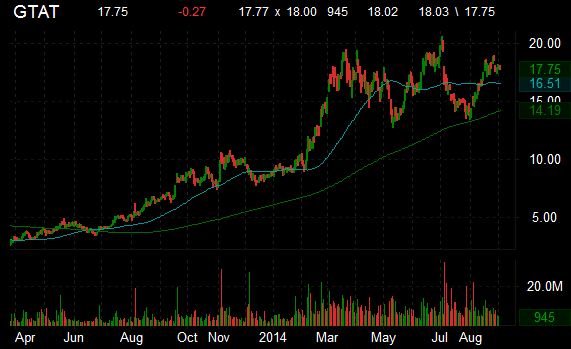
GT Advanced Technologies has a beta of 3.14 and a short float of 39.90%. In the past 52 weeks, shares of GT Advanced Technologies have traded between a low of $6.28 and a high of $20.54 and are now at $18.02. Shares are up a whopping 179% y/y, and 106.7% year-to-date.
The chart below shows where the equity has traded over the last year, with the 50-day and 200-day moving averages included.
Recent short interest data for the 8/15/2014 settlement date shows an increase in short interest for shares of SolarCity Corporation (SCTY). As of August 15, the company’s short interest totaled 12,062,454 shares, as compared to 11,303,256 shares since July 31, an increase of about 6.71%. Average daily volume [AVM] for the same period increased to 5,088,723 shares from 3,227,534 shares. It is worth noting that ticker’s short interest has jumped by almost 5.6M, or 87%, from the 12/31/2013 settlement date.
Based on the latest AVM, the days-to-cover ratio — a metric that includes both the total shares short and the average daily volume of shares traded — is currently 2.37 days. Days-to-cover for SCTY decreased to 2.37 for the August 15 settlement date, as compared to 3.50 days at the July 31 report.
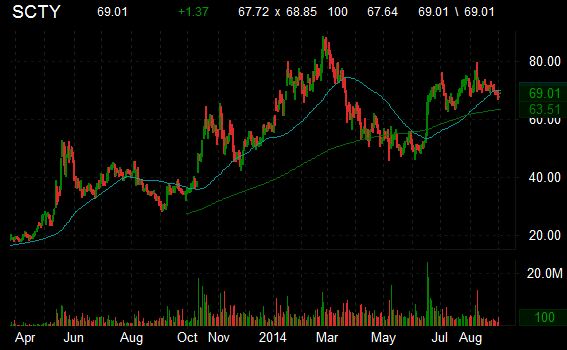
SolarCity has a beta of 5.66 and a short float of 29.10%. In the past 52 weeks, shares of SolarCity Corporation have traded between a low of $28.31 and a high of $88.35 and are now at $67.64. Shares are up a whopping 115.83% y/y, and 19.04% year-to-date.
The chart below shows where the equity has traded over the last year, with the 50-day and 200-day moving averages included.
Disclaimer: This page contains affiliate links. If you choose to make a purchase after clicking a link, we may receive a commission at no additional cost to you. Thank you for your support!
Leave a Reply