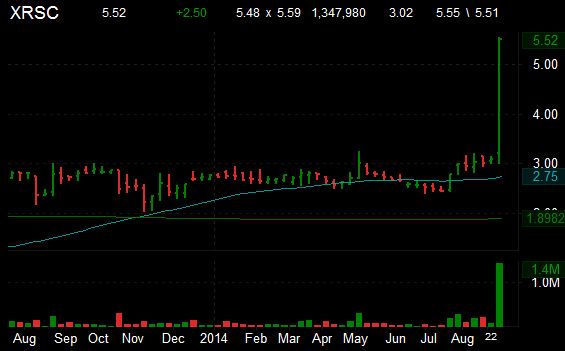
Shares of XRS Corp (XRSC) shot up more than 82% today with price breaking out to a fresh 8-year high after the company announced that it had agreed to be acquired by Omnitracs, LLC. Omnitracs, a provider of fleet management solutions to transportation and logistics companies said it will pay $5.60 per share of XRS Corp., which equates to $178 million in equity value.
XRSC closed at $5.52 on a traded volume of 1.34 million shares, compared to the average volume of 22.488. XRS Corp has a total market capitalization of $61.97 million.
The chart below shows where the equity has traded over the last year, with the 50-day and 200-day moving averages included.
Shares of Digital Ally (DGLY) soared 79% on Tuesday after the company’s CEO said inquiries from potential customers regarding the company’s audio/video surveillance products have increased five-fold following the events in Ferguson, MO.
Late last week, Digital Ally CEO Stanton Ross was quoted as stating to USA Today that the company had increased its full-year revenue guidance to $22.5 million, which equates to gains of more than 26% from $17.8 million in fiscal 2013.
After spiking nearly 400% through Friday, Digital Ally shares surged another 79.05% to $33.41 Tuesday. More than 20.769 million shares had changed hands, compared to the average volume of 1,997,550. DGLY is up more than 263% this year and has risen roughly 198% over the past 12 months. The company has a total market capitalization of $57.63 million.
The chart below shows where the equity has traded over the last year, with the 50-day and 200-day moving averages included.
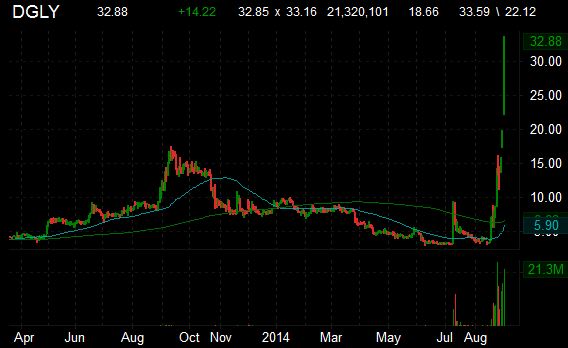
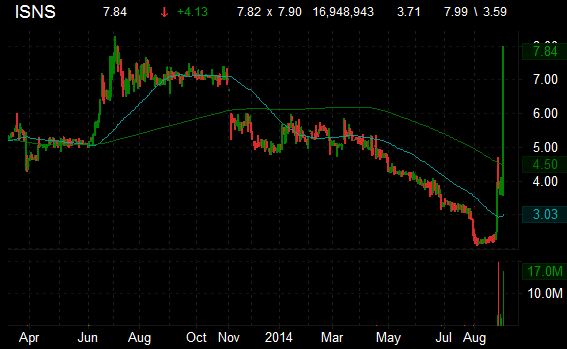
Image Sensing Systems, Inc. (ISNS), which develops software-based computer enabled detection products rose a whopping 122% to $8.20 in sympathy with DGLY. More than 16 million shares changed hands, compared to the average volume of 488,002 . ISNS is up more than 34.50% this year. The company has a total market capitalization of $33.24 million.
The chart below shows where the equity has traded over the last year, with the 50-day and 200-day moving averages included.
Disclaimer: This page contains affiliate links. If you choose to make a purchase after clicking a link, we may receive a commission at no additional cost to you. Thank you for your support!
Leave a Reply