The Bureau of Economic Analysis announced today that U.S. real GDP grew at a 3.2% annual rate in the fourh quarter. That’s two quarters in a row now of above average growth. Given recent experience, that sounds pretty good.
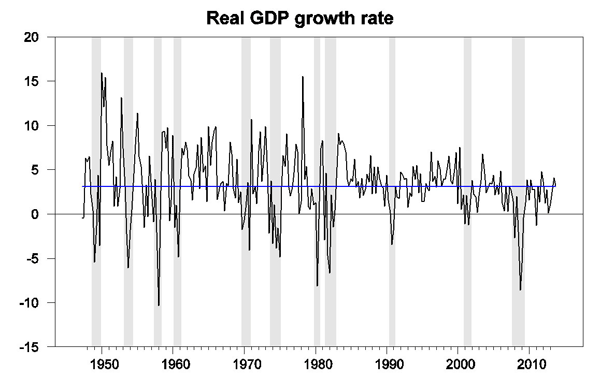
U.S. real GDP growth at an annual rate, 1947:Q2-2013:Q4. Blue horizontal line is drawn at the historical average (3.1%).
The brightest star was U.S. exports of goods and services, which contributed 1.5 percentage points to the 3.2% total. Nearly half of the export gains came from the foods, feeds, and beverages category, in which agricultural goods shipped to China figured prominently. Another important contribution came from exports of nondurable industrial materials. This includes exports of refined petroleum products, which are one byproduct of growing domestic production of crude oil.
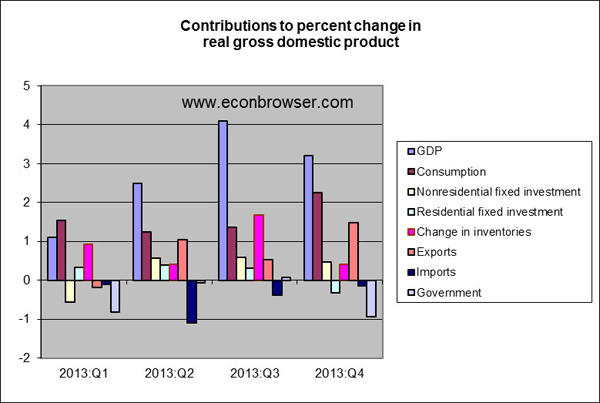
The biggest drag came from the public sector, resulting in part from the federal shutdown in October. Lower government purchases of goods and services subtracted 0.9 percentage points from the fourth-quarter GDP growth rate. Bill McBride believes that public spending and private investment should make positive contributions in the current year:
[Residential investment] should make a positive contribution in 2014, the drag from the Federal Government should diminish, state and local governments should make a small positive contribution again this year, and investment in equipment and software and non-residential structures should also be positive in 2014.
Two quarters of above-average GDP growth have brought our Econbrowser Recession Indicator Index down to 3.3%, which is a very favorable reading. Note that in calculating this index we allow one quarter for data revision and trend recognition. Thus the latest value, although it uses the GDP numbers released today, is actually an assessment of the state of the economy as of the end of 2013:Q3. However, our index is never revised, so that the numbers plotted in the graph below since 2005 are exactly the values as they were reported one quarter after each indicated historical date on Econbrowser.
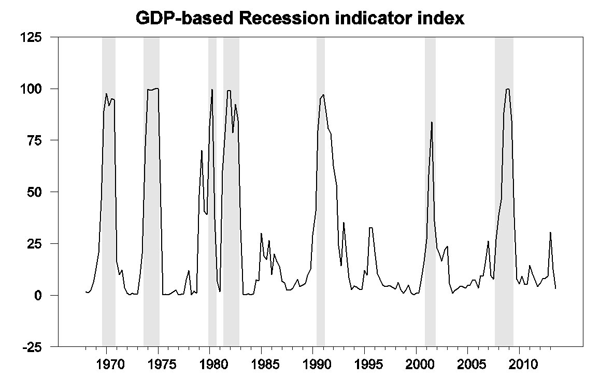
GDP-based recession indicator index. The plotted value for each date is based solely on information as it would have been publicly available and reported as of one quarter after the indicated date, with 2013:Q3 the last date shown on the graph. Shaded regions represent the NBER’s dates for recessions, which dates were not used in any way in constructing the index, and which were sometimes not reported until two years after the date.
To sum up: things are looking good, and are likely to get even better.
Disclaimer: This page contains affiliate links. If you choose to make a purchase after clicking a link, we may receive a commission at no additional cost to you. Thank you for your support!

Leave a Reply