For months now, we’ve been waiting to hear how much Obamacare will drive up the cost of health insurance for people who purchase coverage on their own. Last week, the U.S. Department of Health and Human Services finally began to provide some data on how Americans will fare on Obamacare’s federally sponsored insurance exchanges. HHS’ press release is full of happy talk about how premiums will be “lower than originally expected.” But the reality is starkly different.
Based on a Manhattan Institute analysis of the HHS numbers, Obamacare will increase underlying insurance rates for younger men by an average of 97-99%, and for younger women by an average of 55-62%. Worst off is North Carolina, which will see individual market rates triple for women and quadruple for men.
Earlier this month, I and two colleagues from the Manhattan Institute — Yevgeniy Feyman and Paul Howard — published an interactive map that detailed Obamacare’s impact on individually purchased health insurance premiums in 13 states plus D.C. As another article I wrote described, Obamacare increased premiums in those states by an average of 24%.
But those states were largely blue states that had set up their own state-based insurance exchanges. The big data dump that we’ve been waiting for since then is from the majority of states that didn’t set up their own state-based exchanges.
Those data are the responsibility of the Obama administration, namely HHS. Finally, with less than a week to go before the exchanges are supposed to go on line, HHS has released a slim, 15-page report and a press release that summarizes some of the premium data.
“Premiums nationwide will also be around 16% lower than originally expected,” HHS cheerfully announces in its press release. But that’s a ruse. HHS compared what the Congressional Budget Office projected rates might look like — in 2016 — to its own findings. Neither of those numbers tells you the stat that really matters: how much rates will go up next year, under Obamacare, relative to this year, prior to the law taking effect.
Former Congressional Budget Office director Douglas Holtz-Eakin agrees. “There are literally no comparisons to current rates. That is, HHS has chosen to dodge the question of whose rates are going up, and how much. Instead, they try to distract with a comparison to a hypothetical number that has nothing to do with the actual experience of real people.”
The HHS report doesn’t provide enough details about Obamacare’s premiums for us to incorporate the data into our interactive map. Our map compares the five cheapest plans available on the market today with the five cheapest plans available on Obamacare’s exchanges. The HHS report offers only the cheapest bronze, silver and gold plans and the second-cheapest silver plan.
We look at rates for 27-, 40-, and 64-year-olds, and rates for men and women. (Under Obamacare, rates for men and women are the same, which has the net effect of disproportionately increasing rates for men, who generally paid less under the old system.) The HHS report offers rates for 27-year-olds, and rates for the average-aged exchange participant, a figure that varies by state, but seems to generally land in the mid-30s.
So we conducted two comparisons between pre-ACA data and post-ACA data, as reported by HHS. The first comparison is between the cheapest plan available to 27-year-olds pre- and post-Obamacare.
The second is between the cheapest plan available to the average exchange participant and to the typical 40-year-old pre-Obamacare. We would have liked to have compared rates for older individuals, but HHS didn’t report that data.
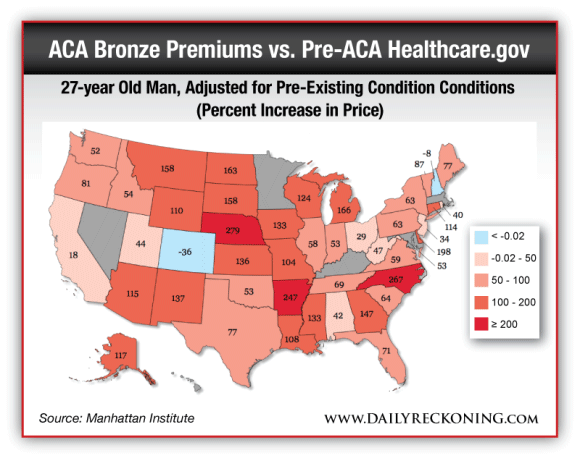
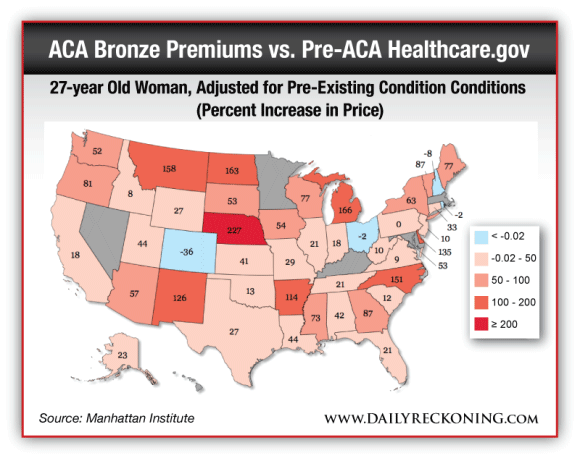
As you can see from the map above, many 27-year-olds will face steep increases in the underlying cost of individually purchased insurance under Obamacare. For the states where we have data — the 36 reported by HHS, plus nine others that we had compiled for our map that HHS didn’t report — rates will go up for men by an average of 97%; for women, 55%. (In the few cases where HHS reported on states that our map includes, we went with HHS’ numbers.)
Worst off was Nebraska, where the difference between the cheapest plan under the old system and under Obamacare was 279% for men and 227% for women — more than triple the old rate. Faring best was Colorado, where rates will decline for both 27-year-old men and women by 36%. The only other state to see a rate decline in this analysis was New Hampshire: 8% for both men and women.
(Still missing are data from Hawaii, Kentucky, Massachusetts, Maryland, Minnesota and Nevada. The data from New York and New Jersey should be taken with a grain of salt, as their individual insurance markets are not like those of other states.)
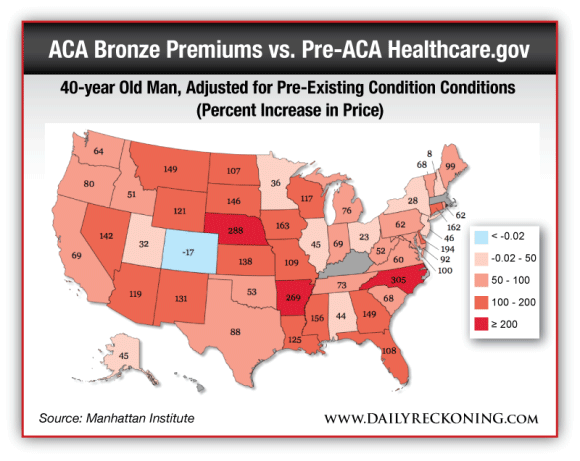
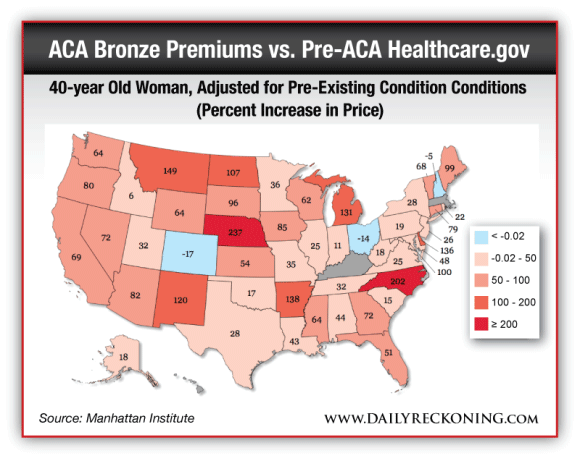
Forty-year-olds, surprisingly, will face a similar picture. The cheapest exchange plan for the average enrollee, compared with what a 40-year-old would pay today, will cost an average of 99% more for men, and 62% for women.
For this cohort, men fared worst in North Carolina, with rate increases of 305%. Women got hammered in Nebraska, where rates will increase by a national high of 237%. Again, Colorado and New Hampshire fared best, with 17% and 5-8% declines, respectively.
Remember that here we aren’t conducting an exact comparison. Instead, we’re comparing the lowest-cost bronze plan offered to the average participant in the exchanges with the cheapest plan offered to 40-year-olds today. This approach artificially flatters Obamacare, because the median age of an exchange participant is, in most states, below the age of 40.
In both the 27-year-old and 40-year-old comparisons, we adjusted the pre-ACA rates to take into account people who would be charged more for insurance, or denied coverage altogether, due to a pre-existing condition using the same methodology we’ve used in the past.
All of the analyses I’ve discussed thus far involve changes in the underlying cost of health insurance for people who buy it for themselves. Many progressives object to this comparison, because it doesn’t take into account the impact of Obamacare’s subsidies on the net cost of insurance for low-income Americans.
I’ve long argued that it’s irresponsible to ignore the change in underlying premiums, because subsidies protect only some people. Middle-class Americans face the double-whammy of higher insurance premiums and higher taxes to pay for other people’s subsidies. However, it is important to understand how subsidies will impact the decisions by Americans as to whether or not to participate in the exchanges.
If you click on the “Your Decision” tab on our interactive map, you will now find the results, as assembled by Yevgeniy, for the 13 states plus D.C. in our original database. Here’s the bottom line: Most people with average incomes will pay more under Obamacare for individually purchased insurance than they did before.
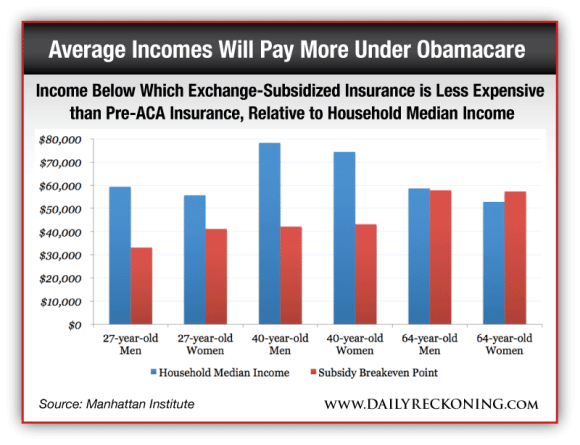
In the 13 states plus D.C., a 27-year-old would have to make 59% of the median income of his peers, or less, to come out ahead with regard to Obamacare’s subsidies. A 40-year-old would have to make less than 57% of the median income for his peers. On the other hand, older people fare better; the average 64-year-old who makes less than 111% of the median income for 64-year-olds will spend less on premiums than he did before.
However, the overall results make clear that most people will not receive enough in subsidies to counteract the degree to which Obamacare drives premiums upward. Remember that nearly two-thirds of the uninsured are under the age of 40. And that young and healthy people are essential to Obamacare; unless these individuals are willing to pay more for health insurance to subsidize everyone else, the exchanges will not serve the goal of providing coverage to the uninsured.
For months, we’ve heard about how Obamacare’s trillions in health care subsidies were going to save America from rate shock. It’s not true. If you shop for coverage on your own, you’re likely to see your rates go up, even after accounting for the impact of pre-existing conditions, even after accounting for the impact of subsidies.
The Obama administration knows this, which is why its 15-page report makes no mention of premiums for insurance available on today’s market. Silence, they say, speaks louder than words. HHS’ silence on the difference between Obamacare’s insurance premiums and those available today tell you everything you need to know. Rates are going higher. And if you’re healthy, or you’re young, the Obama administration expects you to do your duty and pay up.

Leave a Reply