Those of us who believed that the Fed’s program of large-scale asset purchases had only a modest effect on long-term interest rates seem to have some explaining to do.
(click to enlarge)
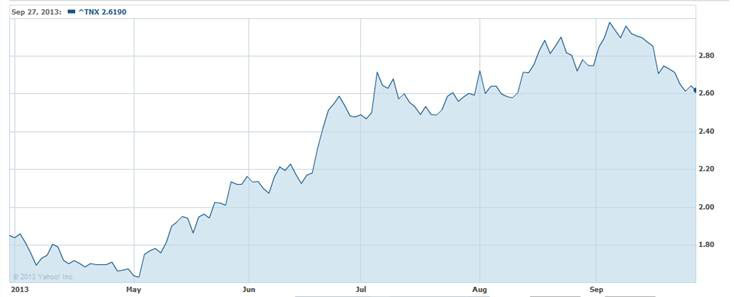
Yield on 10-year Treasury bonds as inferred from CBO TNX, last six months, from Yahoo Finance.
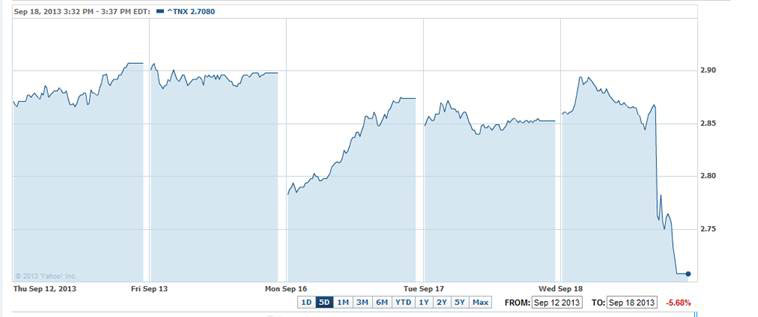
The yield on 10-year U.S. Treasury bonds has fallen 30 basis points over the last few weeks, and there seems little argument that changing views of what the Federal Reserve is planning to do have been the prime mover. There was a 10-basis point drop when markets opened on September 16 after Larry Summers’s withdrawal from consideration of Fed chair, as if this news alone had major implications for financial markets. That change was largely undone during the day. But release of the FOMC minutes that Wednesday, in which the Fed indicated that it was not yet ready to reduce the pace at which it is buying more Treasury and mortgage-backed securities, was clearly viewed as major news by financial markets and the principal factor in this month’s decline in long-term yields.
(click to enlarge)
Yield on 10-year Treasury bonds as inferred from CBO TNX, week of Sep 12 – 18, from Yahoo Finance.
The Fed’s ongoing program of large-scale asset purchases, popularly referred to as its third round of quantitative easing (or QE3), has resulted in the Fed adding $414 B to its holdings of Treasury securities between September 2012 and September 2013, or a realized pace of about $35 B each month in net additions to its portfolio after one takes into account redemptions of maturing securities. As of September 25, the Fed held $2,062 B in Treasury securities, which constitute about 17% of the $11,907 B in Treasury debt held by either the Fed or the public.
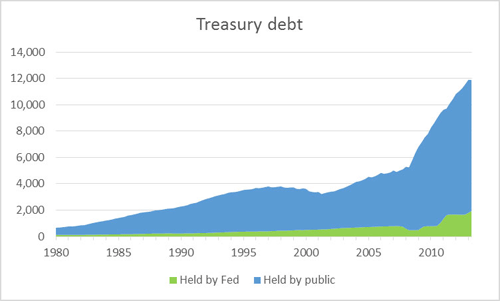
Treasury debt held by the public and by the Federal Reserve, 1980:Q1 to 2013:Q2, in billions of dollars. Data source: lines 1 and 15, Table L209, Flow of Funds.
One theory maintains that by taking a large enough share of the outstanding long-term Treasury debt off of private-sector balance sheets the Fed can reduce the private sector’s exposure to long-term interest rate risk and thereby flatten the yield curve. But as one can see from the above graph, despite the Fed’s QE3 and the Treasury’s declining budget deficits, the volume of Treasury securities held by the non-Fed public has continued to grow impressively, increasing by $586 B over the last year. The Fed’s QE3 program may have kept interest rates from rising more than they otherwise would, but would not be an explanation by itself for a low level of interest rates overall.
No one expected the Fed to announce a complete cessation of its purchases at the September meeting, only a “taper”, or gradual slowdown in the pace of net purchases. Suppose for illustration that the Fed had announced at the last meeting that it was going to start reducing its net purchases of Treasury securities by $2.5 B per month beginning in October, so that it would be down to zero net purchases by November 2014 (in other words, back to maintaining a constant stock rather than allow its holdings to continue to grow further). Even though the Fed did not make such an announcement after its September meeting, there should be no doubt that a similar announcement is coming soon. Let’s say that in fact the Fed is not going to begin tapering until January, with net purchases not reaching zero until February 2015. The difference between the two paths I just described is that the Fed would end up holding about $100 B more in Treasury securities at the end of 2014 than if it had begun the tapering immediately. That’s a difference of less than 1% in the current stock of Treasury debt. This news is supposed to shave 30 basis points off the 10-year yield?
Some argue that it is not the Fed’s holdings as a share of the stock of outstanding debt that matters, but instead the share of the flow of newly issued debt that is purchased by the Fed. Of the $862 B in net bond sales from the Treasury to the public between June 2012 and June 2013, the Fed ended up with $277 B, or 32% of the new flow as opposed to 17% of the outstanding stock. A change in the flow of $2.5 B per month such as discussed above would represent 3.5% of last year’s flow pace of $862 B/year.
There are in any case substantial problems with the “flow” view of the importance of QE3. For one thing, it is hard to arrive at it from any economic model. Anyone who holds Treasury securities is free to sell them at any time they like, which is why the equilibrium price (or yield) must be such that the stock currently held is the quantity investors want to hold. That is a theory of the equilibrium interest rate that is based on stocks, not flows. Moreover, there’s been zero change so far in the flow, meaning the entire argument comes down to a story based on anticipation of future flows. And how can anticipation of future flows matter? It only matters insofar as it leads to a reassessment by investors about whether they want to be holding the existing stock given the current and anticipated future yield. In other words, the only way to get a story based on flows to work is ultimately to reframe it in the standard way, namely in terms of finding the yield at which investors are willing to hold the current stock.
Another and perhaps more important component of QE3 has been purchases by the Fed of mortgage-backed securities. Here it is more difficult to calculate the fraction of the total stock of such securities the Fed is holding, because there is a range of assets with similar characteristics. What I have done in the graph below (partly because it seemed the simplest thing to do given the way the Fed’s Flow of Funds accounts are structured) is to look at the Fed’s MBS holdings relative to the total stock of agency- and GSE-backed securities. As of June, the Fed’s $1,277 B in MBS represented 17% of the total stock.
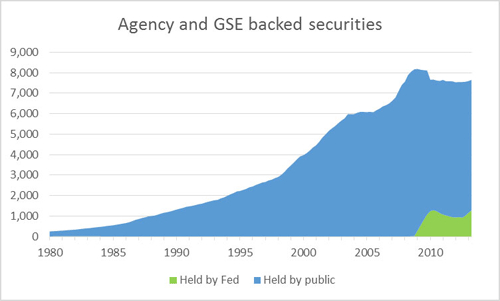
Agency- and GSE-based securities held by the public and by the Federal Reserve, 1980:Q1 to 2013:Q2, in billions of dollars. Data source: lines 1 and 11, Table L210, Flow of Funds.
And indeed one can make the case that Treasury securities and MBS are just part of a broader asset class, against which their yields get arbitraged globally, making claims that such large impacts on yields could be attributed to a modest change in the timing of the tapering even harder to understand.
The indicated conclusion is that it is not the asset purchases themselves, but rather what they may signify about future Fed policy, that really matters for financial markets. It’s interesting to note that fed funds futures began to show some life again this spring, when discussion of Fed tapering was also in the air. The Fed has kept the fed funds rate under 25 basis points for 4 years. But at some point it will allow this (or some other summary of low-risk short-term interest rates such as the interest rate that the Fed pays on reserves) to begin to rise. The graph below shows the price of a futures contract that pays off based on what the fed funds rate turns out to be in September of 2014; to get the implied interest rate, subtract from 100. The run-up in 10-year yields last June as well as the start of this month were both associated with September 2014 fed funds futures above 25 basis points (or a price below 99.75 on the graph below). Although the Fed views its decision to start raising short-term rates as something that will come significantly later than any tapering of large-scale asset purchases, the market seems to be assigning some probability that the next cycle of rate hikes could begin before the end of next year. And that assessment seems to be tied closely to speculation as to when tapering will first be announced.

(click to enlarge)
Price of September 2014 fed funds futures contract. To get the implied fed funds rate, subtract the plotted value from 100. Source: CME.
Alternatively, one can look at forward rates implied by the current term structure of Treasury yields. The basic idea of a forward rate is to consider the return I could get if I were to sell $1000 worth of a bond that I have to pay back with interest 365 days from now and simultaneously buy $1000 worth of a bond that will pay me back with interest 366 days from now. In other words, I pay nothing on net today, will owe something 365 days from now, and get some money back 366 days from, so I’ve locked in using today’s interest rates the return on a one-day loan that I’m not going to make until a year from now. The graph below plots this one-year forward rate along with a 2-year forward rate (the return I could lock in today on a 1-day loan to be made 2 years from now).
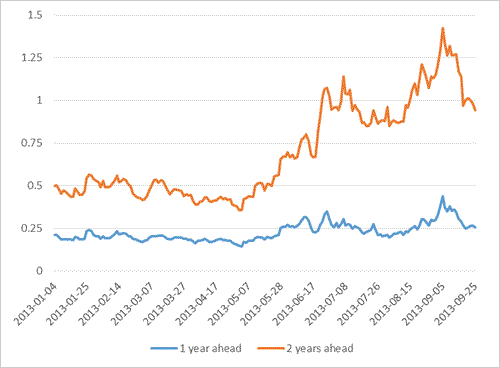
One-year forward and two-year forward overnight interest rate, daily Jan 4 – Sep 25, as inferred from the Gurkaynak, Sack, and Wright (2007) methodology. Data source: Federal Reserve.
These also signal a view as of the start of this month that the Fed would have begun the next cycle of rate hikes by this time next year, with the short rate up above 1.25% within two years. As the market changed its assessment about the timing of the taper, there was a corresponding change in assessment of the timing of the rate hikes.
There is also a potential contribution of a risk-premium to these longer-range futures and forward rates, which may matter at this point in the cycle. Nevertheless, I think the correct overall interpretation of the data over the last few months is consistent with the view I offered last year:
the primary significance of large-scale asset purchases is not their direct effects, but rather their usefulness as a supplementary signaling device, adding an exclamation point, if you will, to the Fed’s communication of its future intentions.
My conclusion is that it’s the prospect of future rate hikes, not plans of tapering, to which markets have recently been reacting.
Disclaimer: This page contains affiliate links. If you choose to make a purchase after clicking a link, we may receive a commission at no additional cost to you. Thank you for your support!


Leave a Reply