We’ve been seeing oil over $100 a barrel and gasoline above $3.40 a gallon for much of the last 3 years. Those prices would have shocked many Americans a few years ago, but have now become the new normal. What has changed and what hasn’t as a result?
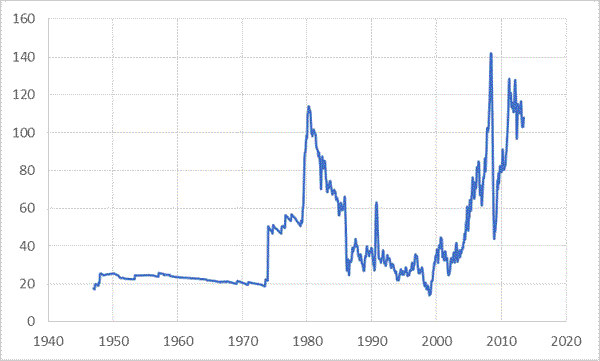
Real price of oil (in 2013 dollars), Jan 1947 to July 2013. Oil price: 1947-1989 based on West Texas Intermediate from FRED; 1990-2013 based on Brent from EIA, converted to current dollars using the CPI.
One effect of higher oil prices has been a surge in U.S. oil production coming from horizontal fracturing of shale and other tight formations. These methods would not have been profitable at the oil prices of 2004, and it’s not clear how long the new supplies will last. But for now they are making an important contribution to U.S. income and employment.
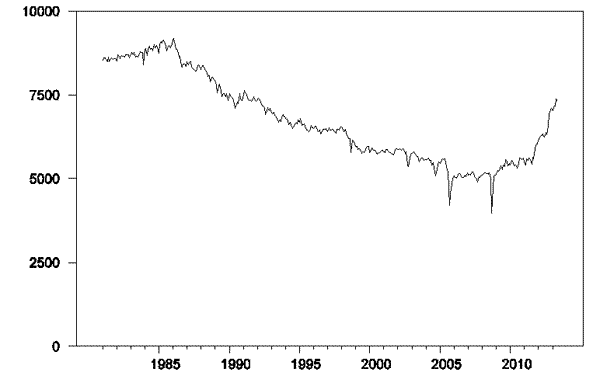
U.S. field production of crude oil in thousands of barrels per day, Jan 1981 to May 2013. Data source: EIA.
Higher prices have also led to significant changes in U.S. driving habits and the kinds of cars we buy.
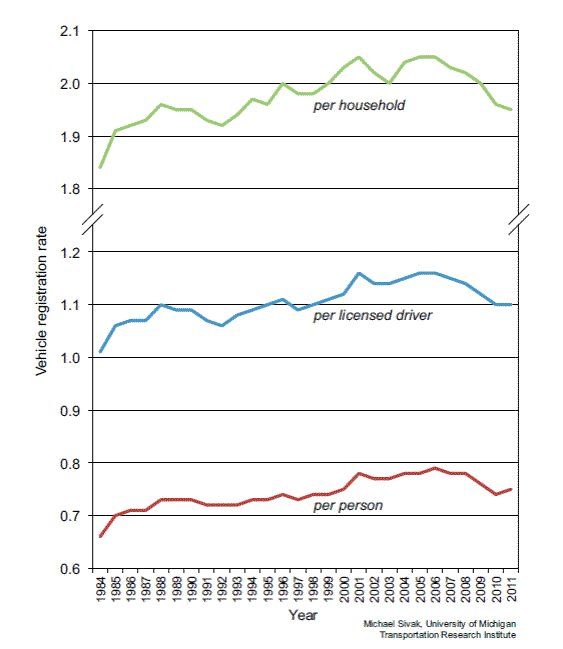
Registered light-duty vehicles per person, per licensed driver, and per household. Source: Sivak (2013)
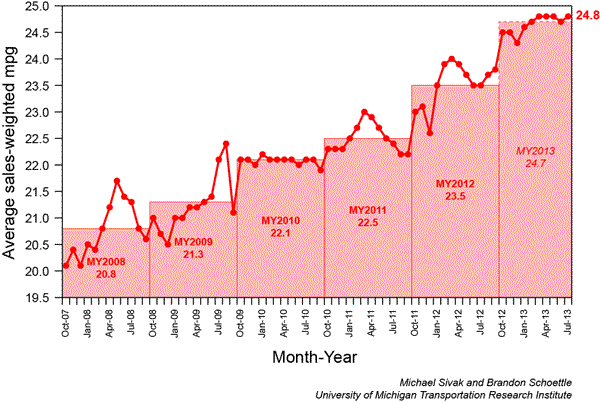
Average miles per gallon of light-duty vehicles newly sold in the United States. Source: UMTRI.
The result has been that U.S. petroleum consumption, which for years seemed like it could only go up, has been steadily declining.
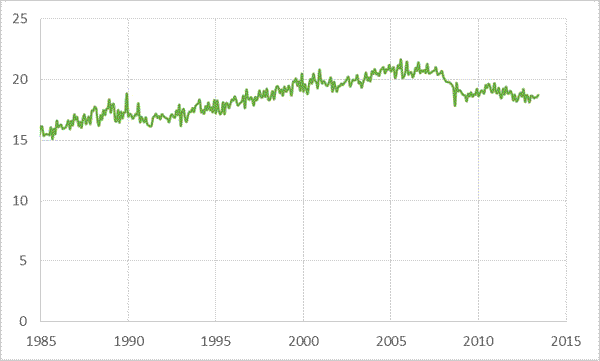
U.S. product supplied of crude oil and petroleum products, millions of barrels per day, Jan 1985 to Jun 2013. Data source: EIA.
Higher domestic production and lower American consumption have meant declining imports of crude oil and petroleum products– a reversal of another once seemingly inexorable trend.
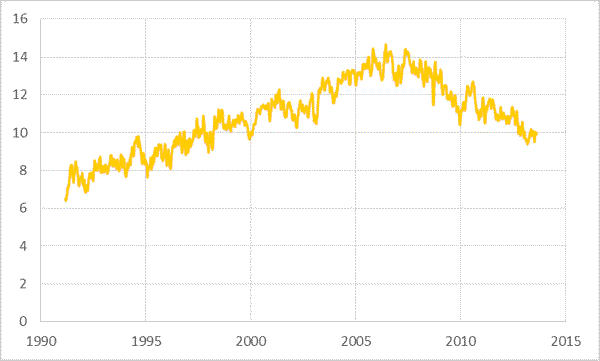
Four-week average U.S. gross imports of crude oil and petroleum products, Mar 8, 1991 to Aug 23, 2013, in millions of barrels per day. Data source: EIA.
The price differential between internationally traded crude oil and that produced in central North America gave U.S. refiners a competitive advantage to export refined petroleum products. The quantities are significant, but are still swamped by the volume of crude oil imports portrayed in the graph above.
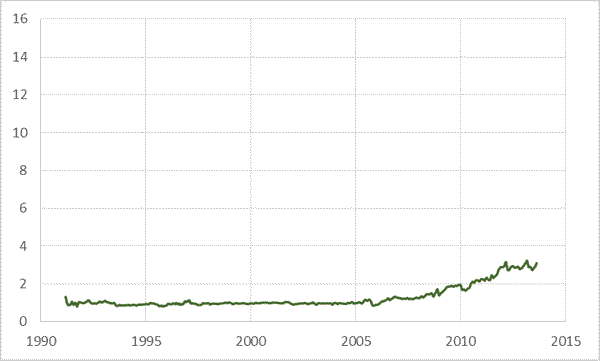
Four-week average U.S. gross exports of crude oil and petroleum products, Mar 8, 1991 to Aug 23, 2013, in millions of barrels per day. Data source: EIA.
The economic burden of imported oil is represented not by the number of barrels, but instead by the real value of the resources we must surrender in order to obtain the oil. The dollar value of petroleum imports as a share of GDP has come down a little as a result of recent gains in production and conservation, but still remains significantly elevated relative to the levels of a decade ago.
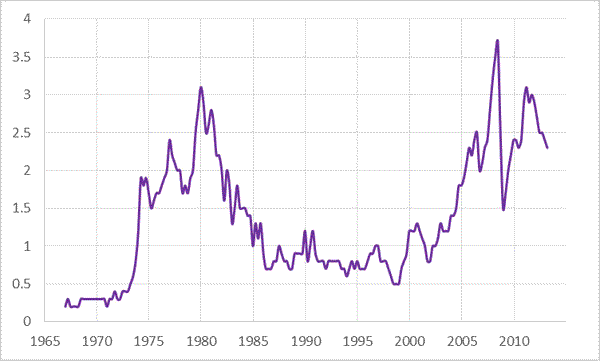
Dollar value of U.S. imports of petroleum and products (from BEA Table 4.2.5) as a percent of GDP (from FRED, 1967:Q1-2013:Q2.
In other words, despite impressive gains in production and conservation, the bill for oil imports remains a significant burden on the U.S. economy.
Disclaimer: This page contains affiliate links. If you choose to make a purchase after clicking a link, we may receive a commission at no additional cost to you. Thank you for your support!


Plug your Tesla S, electric car into your household, solar array.