The term “squeeze” is used rather imprecisely in financial markets. To me, the term means an exercise of market power in a financial market, usually a derivatives market, like a futures market, options market, or the securities loan market.
One commonly advanced explanation for the runup in Tesla’s stock price is a squeeze of the shorts. That is, those who short sold the stock by borrowing it and selling it in anticipation of buying back at a lower price. In this context the term “squeeze” is not usually used to refer to a purposeful exercise of market power, but it is difficult for the liquidation of short positions to affect prices-and distort them-in the absence of the exercise of market power.
Tesla is a heavily shorted stock: In March, about 40 percent of the float was short. The stock has experienced a big runup, and one widely advanced explanation is that the shorts have been squeezed. Given that I wrote the book on manipulation (#4,345,667 on Amazon! But now in paperback! Only $275!-of which I see exactly $0.00! Also on Kindle for a mere $220! How can you pass that up?), I thought I would take a rigorous, data-based look at the subject.
In the absence of manipulation, the forward price of a stock should be the current spot price plus the cost of financing the position at the prevailing interest rate until the delivery date on the forward. In the absence of a squeeze, the cost/fee to borrow the stock should be small. However, in a squeeze, it is costly to borrow the stock: the bigger the squeeze, the bigger the cost of borrowing. This borrowing cost depresses the forward price. Thus, during a squeeze, the forward price is below the spot price plus financing costs. The differential between these is a measure of the severity of the squeeze.
I can’t observe borrowing costs directly, and there is no explicit forward market for Tesla (NASDAQ:TSLA) stock. But there is an options market that trades fairly actively. Given put and call prices, and the associated strike prices, I can use put call parity to estimate an implied forward price:
F=(1+rT)(c-p)+K
where c is the call price, p is the put price, K is the strike price, r is the interest rate (I use Libor), and T is the fraction of a year to expiration of the option. I do this for every strike on Tesla options expiring in May, June, and September: there is one implied forward price for every strike. I then use the median and average across strikes (for each expiry) to estimate F. I then compare F to the no-squeeze forward price, which is (1+rT)S where S is the current price on the stock. (There is little disparity in my estimate of F across strikes, and the mean and median are virtually identical: this gives me confidence that the numbers are solid.)
This figure depicts the spreads between the no-squeeze forward price and the actual forward price: positive values indicate that there is a squeeze:
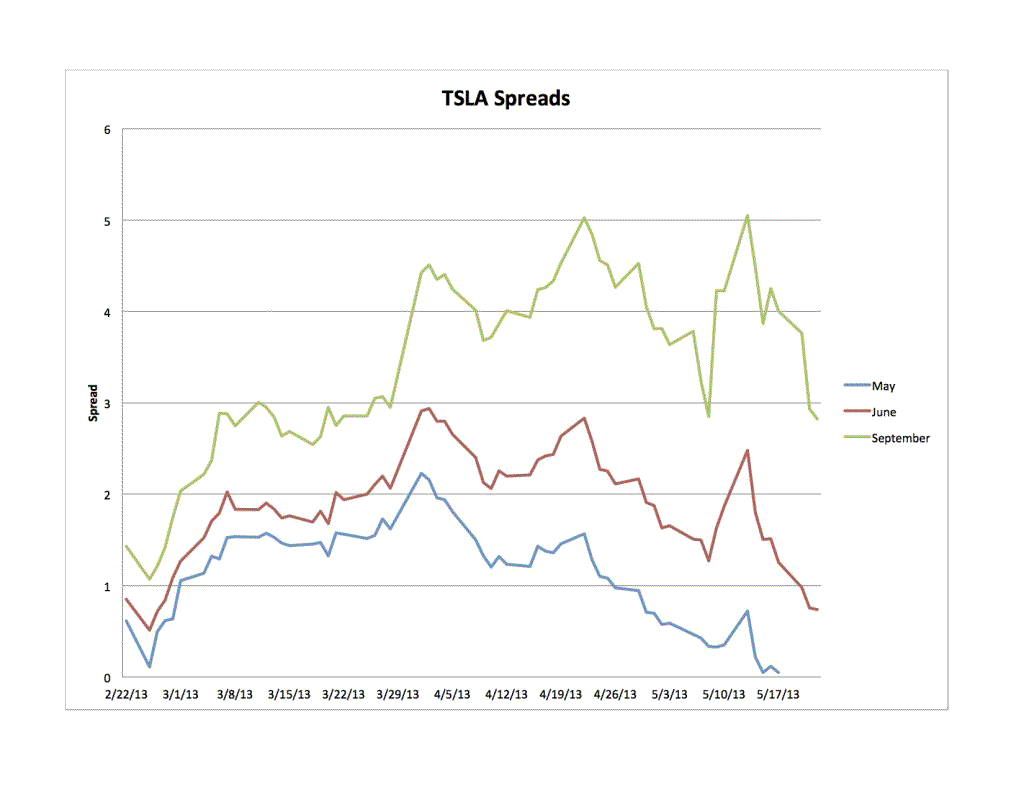
(click to enlarge)
The figure does provide evidence of the exercise of market power. The spreads widened starting in late-February, and then remained elevated throughout April and into May. Some of the drift down observed in the spreads derived from the May and June options is a time to expiration effect: the number of days that short has to pay the borrowing cost caused by the squeeze declines as the option nears expiration, leading to a decline in the spread. This effect is less pronounced for the September options, which is why its spread remains elevated.
On a per day basis, for the June option, the borrowing cost went from about 1.7 cents per day in mid-March and topping out at 4.6 cents/day on 22 April.
Thus, there is pretty compelling evidence of a squeeze during this period.
This can also be illustrated in percentage terms. That is, the borrowing cost can be converted into an annualized percentage rate, like an interest rate. This figure illustrates that:
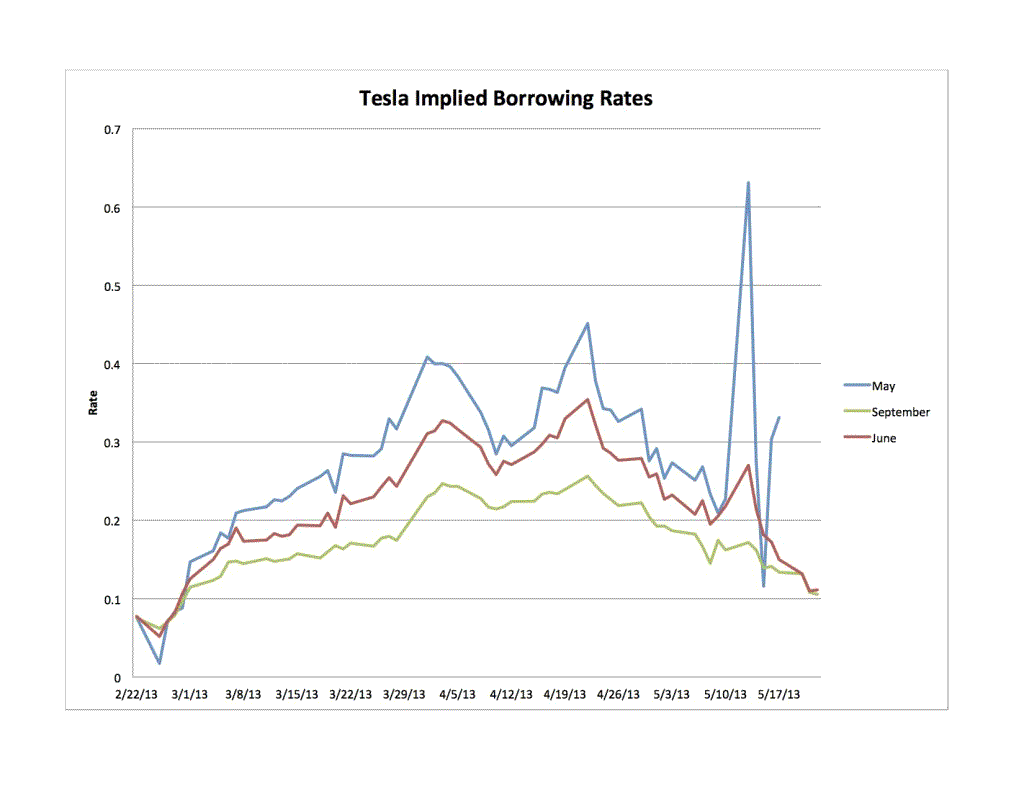
(click to enlarge)
The decline in the May and June percentage rates reflects primarily the increase in Tesla’s stock price. But the numbers are pretty eye-popping. At the peak, the “interest rate” paid to borrow Tesla stock ranged from between about 25 percent (to borrow until 21 September) and 45 percent (to borrow to 17 May). Not quite loan-shark levels, but pretty damn high.
This is further evidence of a squeeze. And note particularly the substantial rise in the spreads, measured both absolutely and in annualized percentage terms from late-February through mid-April. Obviously, the squeeze was building during this time.
The peak of the squeeze, as measured by the spreads (absolute and percentage) was in mid-to-late-April, which corresponds to data on short sales. Short open interest declined from a peak of 32 million shares on 15 March, and then declined to 27.5 million shares on 30 April.
One other thing stands out. Note the spike in spreads on 13 May. Which just happens to be two days before Tesla announced its secondary public offering.
Interesting. Very interesting. I wonder if the SEC is interested. It should be.
Short squeezes cause the stock to be overpriced. Squeezed stocks tend to decline subsequently (Jones & Lamont, 2001). The evidence of the squeeze I’ve presented here, and the Jones-Lamont evidence suggests that Tesla’s price should decline.
When? There’s the rub. Once a squeeze occurs, people are reluctant to short for fear that they may be squeezed again. In the absence of the countervailing effects of short selling, the fan boys can drive the price to insane levels. Moreover, as I’ve shown in my academic work, the stock price is increasing in the probability of a squeeze: if (as is plausible) this probability is higher in the aftermath of a squeeze, this means that Tesla’s stock price currently embeds a squeeze premium.
Eventually this squeeze premium will go away, but given the recent experience, in which shorts were squeezed hard, it is possible that this premium will remain in the price for some time.
There is obviously one big question here: Who is doing the squeezing? I have no idea. Theories involving obvious suspects, but no evidence to back it up, and no real means to develop that evidence. The SEC could figure it out, if it had a mind to. Sadly, based on past experience I’m doubtful it will find the mind, despite the fact that manipulation (including squeezes) is a violation of the securities laws.
And if it bestirs itself, the SEC should look at another Musk company: Solar City (NASDAQ:SCTY). It has been on a dizzying ride too, and there is evidence of a squeeze here too. Indeed, the evidence of the squeeze is even more pronounced here. Note the huge spike in borrowing costs starting at the beginning of the month, after a period of relatively little movement. Very, very strong evidence of a squeeze:
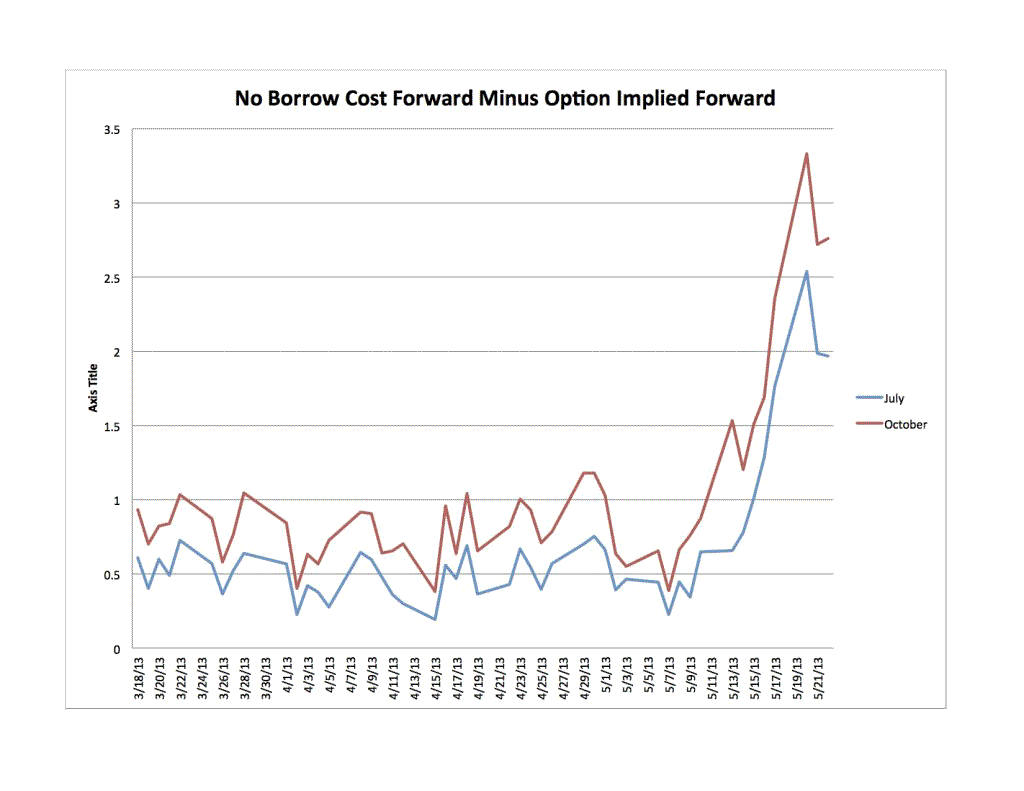
(click to enlarge)
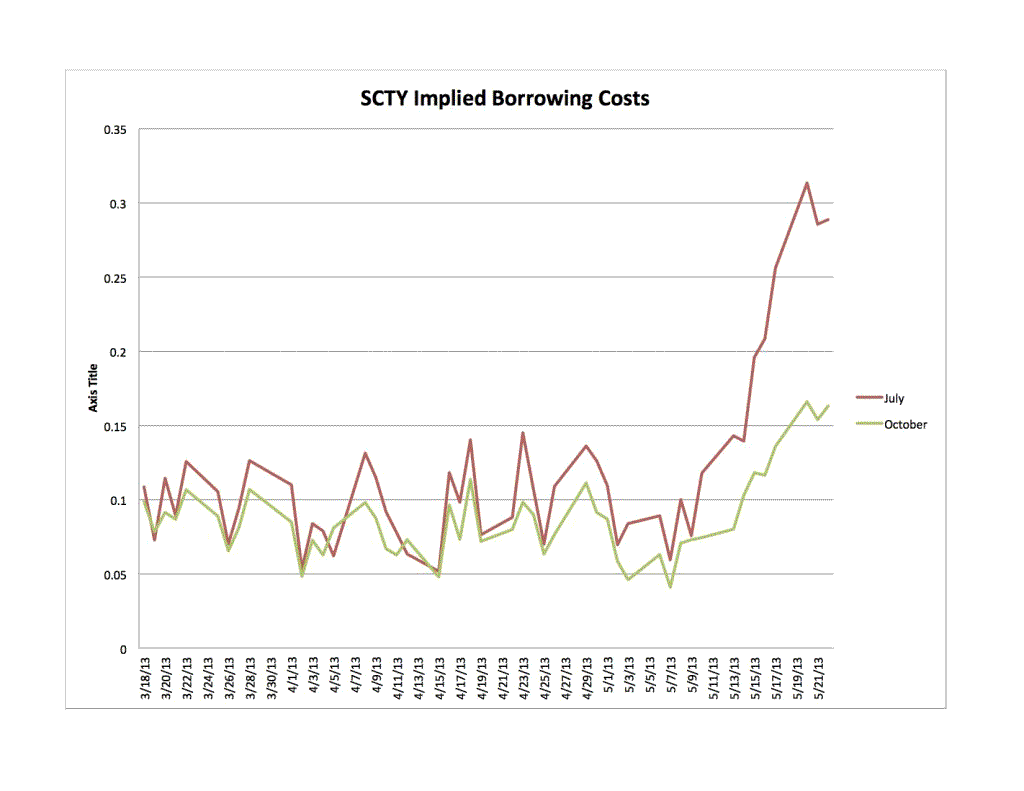
(click to enlarge)
Is anybody home at the SEC? I guess we’ll see.
The takeaway from this is that what are sometimes referred to as “technical factors” are present, with a vengeance, in TSLA and SCTY. Put less euphemistically, both stocks have been squeezed, and pretty hard. Squeezed, as in manipulated.
The big question: who has the squeeze box? Anybody home at the SEC who might try to answer that question?
Disclaimer: This page contains affiliate links. If you choose to make a purchase after clicking a link, we may receive a commission at no additional cost to you. Thank you for your support!


Leave a Reply