Back in the 1970s I was driving near Moncton, New Brunswick when I came across Magnetic Hill. Cars in neutral seem to roll uphill, perhaps due to an optical illusion. I’m going to argue that this strange hill may provide an explanation for the mystery of the last three recoveries, which have been widely labeled “jobless recoveries.”
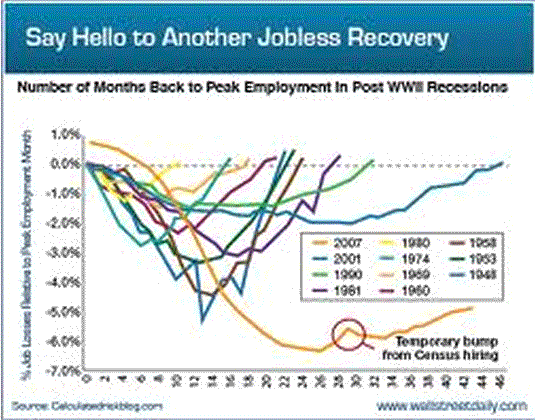
The last three recoveries have been shaped like frying pans, not the V-shape that previously occurred. Most of the explanations I see posit deep structural changes in the economy, and in particular the nature of labor markets. But those theories actually fail on two different levels. First, structural change is very gradual, and we suddenly went from V-shaped to pan-shaped recoveries. More importantly, the real question is not why have robust recoveries in NGDP not led to rapid job growth, but rather why have we not had the usual rapid recoveries in NGDP.
In other words, monetary policy has been relatively tight during the past three recoveries, and hence NGDP growth has been slow. Thus it’s no surprise that we’ve have very slow recoveries in the labor market.
But why have the recent recoveries in NGDP been so slow? Hasn’t monetary policy improved during the “Great Moderation?” Isn’t the business cycle more stable? (At least before 2008?) Yes, monetary policy has improved, but it is still slightly flawed, and that flaw led to an asymmetric bias. Policy was very good at preventing overheating–and hence the recoveries tended to be longer after the 1982 recession, but policy was not so good at promoting a brisk recovery.
So how does Magnetic Hill explain this mystery? Suppose Magnetic Hill is caused by an optical illusion, which makes it seem like you are going uphill, when you are actually going downhill. You’d then put too much pressure on the accelerator in one direction, and too little in the other. Now suppose that since 1983 some sort of mysterious force caused monetary policy to be less expansionary that the Fed anticipated. In that case they’d usually have a more contractionary policy than they wanted, which would extend booms (by preventing overheating) but also slow recoveries from recession. That could explain why money was too tight during the last three recoveries, producing sub-optimal NGDP growth and suboptimal jobs growth.
Nice theory, but do I have any evidence for this mysterious “magnetic force” throwing off monetary policy since 1983. Yes I do!! Recall that NK policy works through adjusting the market interest rate relative to the unobserved Wicksellian equilibrium rate. In practice, all we can do is look backward and estimate the Wicksellian rate by observing actual market rates in relation to the growth rate of prices and output. So in practice economists tend to assume the Wicksellian equilibrium real interest rate is fairly stable, at least averaged over the cycle.
So my theory of a mysterious force causing three consecutive jobless recoveries requires the economics profession to consistently overestimate the Wicksellian equilibrium real interest rates over a period of 30 years. How likely is that?
Perhaps more likely than you’d think. Suppose economists assumed the rate showed no long run secular trend, but in fact a major downward secular trend began in 1983. In that case the Fed would almost always be overestimating the expansionary stance of its policy, producing a bias toward ever lower rates of inflation and NGDP growth. This wouldn’t be much of a problem during booms, after all the Fed was usually too expansionary during booms in earlier decades. But in recessions it would lead to slow recoveries, even if they seemed to be adopting highly expansionary policies.
Is there any evidence for a long downward secular trend in real interest rates since 1983? Yes, there is, indeed this is probably the most notable stylized fact of recent American macro history:
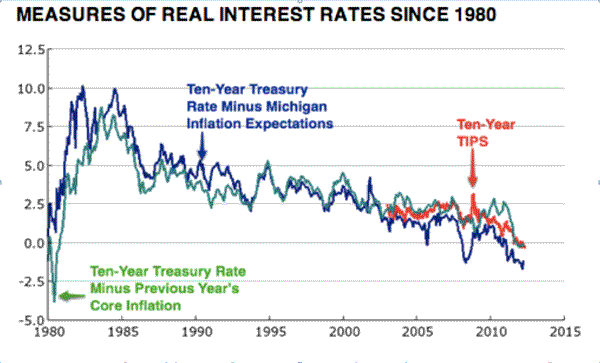
Real interest rates on 10-year T-bonds have fallen from 7% to less than zero percent over the past 30 years. Yes, those are market rates, not Wicksellian equilibrium rates. But since both inflation and NGDP growth have fallen sharply over that 30 year period, the decline in the Wicksellian equilibrium rate must have been even greater!!
It’s only in retrospect that the full importance of this earth-shaking trend has begun to sink in. The Fed has now realized that low rates aren’t enough, and have moved toward more aggressive stimulus. Ditto for the Japanese. Stock investors now realize that low rates are not simply a cyclical pattern, but at least partially reflect a deep secular trend. That means equity prices needed to be adjusted upward, and the process is well underway. In fairness to my progressive friends, infrastructure projects that were not cost effective in 1983, suddenly are cost-effective in 2013, even if not used to stimulate the economy.
Low interest rates are the new normal, we all better learn to get used to it.
Disclaimer: This page contains affiliate links. If you choose to make a purchase after clicking a link, we may receive a commission at no additional cost to you. Thank you for your support!


Leave a Reply